Welcome to Ucharts app Review
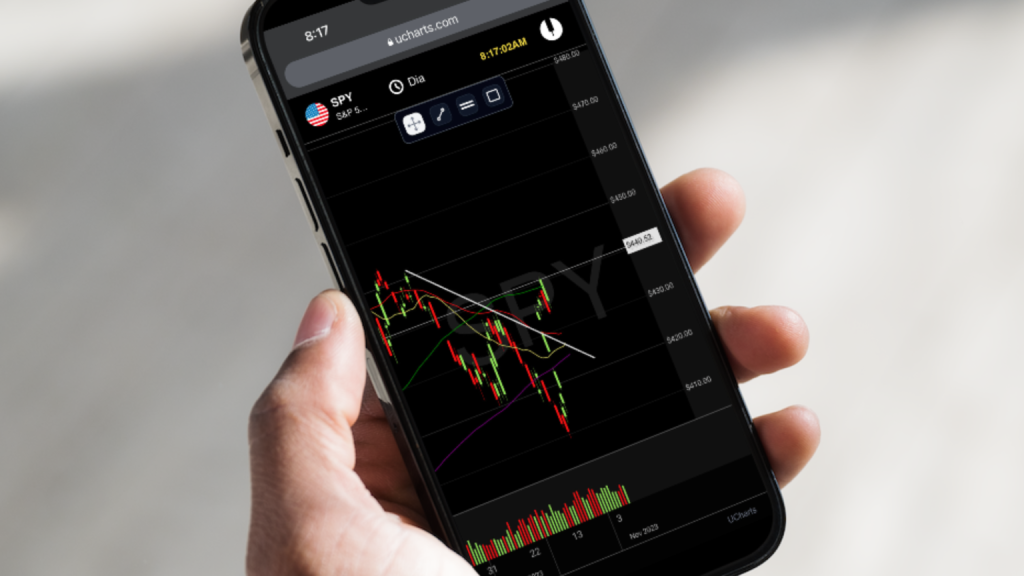
Stock Market Analysis, Made Simple, Professional charts for technical analysis.
UCHART App Review
Save 2 months with our annual plan.
UCharts is an easy-to-use, user-friendly tool that adapts to modern mobile devices and browsers. It offers a wide variety of charts and data visualizations to help you understand patterns and trends with clarity and precision. Whether for business or personal information, UCharts is the perfect solution for visualizing your data easily.
WANT TO KNOW MORE
We empower you with the information you need.
uCharts allows you to make important decisions with accurate, real-time data. It’s easy to use with multiple ways to analyze data and create custom charts and graphs.
Install Our Web App
Install our web app, available in modern browsers, for immediate access.
Real-Time Graphics
Get real-time data for the most popular stock symbols.
Make Informed Decisions
UCharts helps you make informed decisions before you buy or sell.
Your updates in the cloud
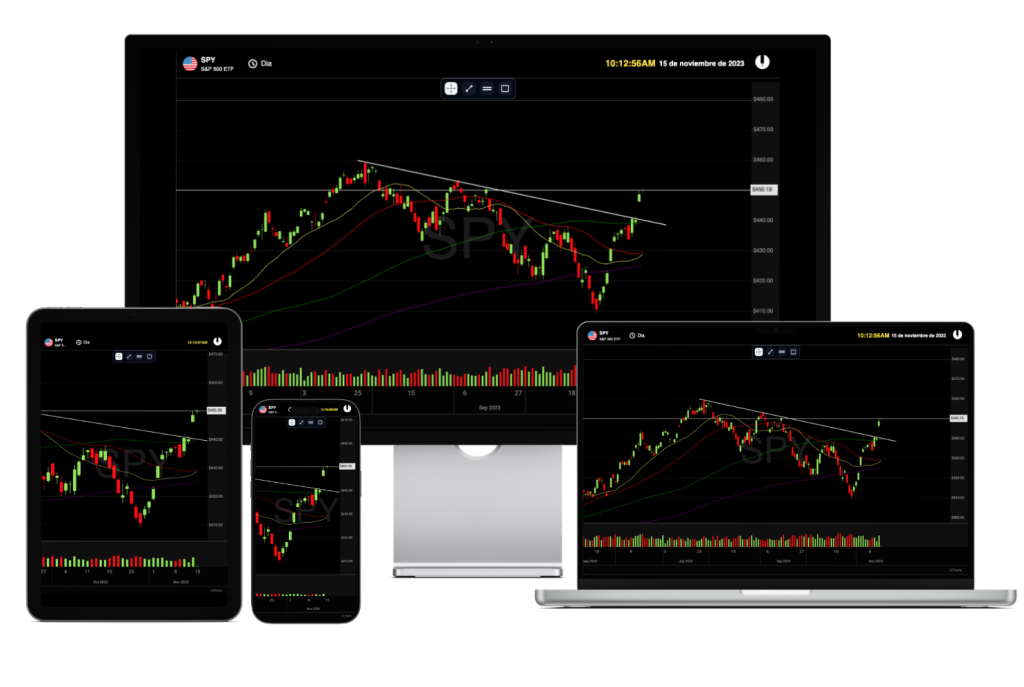
Any updates you make are instantly saved to the cloud, allowing you to seamlessly switch from one device to another.
Simplify chart analysis for everyone.
Why uCharts? We’ll explain:
Optimal Configuration
It offers the precise configuration you need for stock market analysis.
Ease of Use
The platform is easy to use and designed with you in mind. It’s also compatible with modern mobile devices and browsers!
Real-Time Data
Get real-time data for the stock symbols of S&P 500 companies and others.
-
Introduction to Ucharts: Revolutionizing Data Visualization
Data visualization is an essential tool in today’s world of business intelligence. In an era where data is king, the ability to present it effectively can make all the difference in decision-making processes. Ucharts is here to revolutionize the way we look at data visualization. Whether you’re a business owner, analyst, or data scientist, Ucharts provides an intuitive platform for…
-
Unlocking the Benefits of Using Ucharts: A Powerful Tool for Data Visualization and Business Insights
In today’s data-driven world, understanding and interpreting data is key to making informed decisions. Whether you’re a business owner, marketer, or student, presenting data in an easy-to-understand format is crucial for conveying your message. This is where Ucharts comes in. But what exactly is Ucharts, and why should you consider it for your data visualization needs? In this article, we’ll…
-
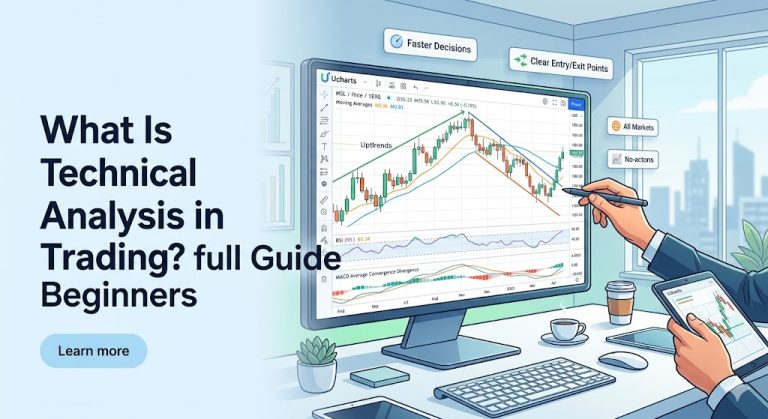
What Is Technical Analysis in Trading? Full Guide for Beginners
Technical analysis is a method of predicting price movements using historical chart data and indicators. Key Concept Markets move in patterns, and technical analysis…
-
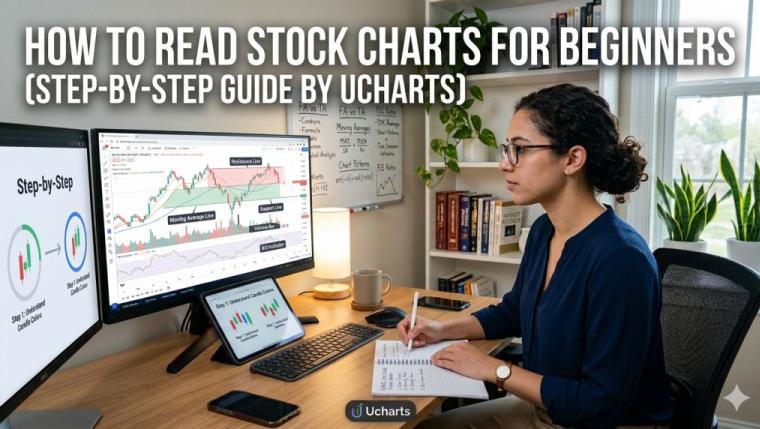
How to Read Stock Charts for Beginners (Step-by-Step Guide by Ucharts)
Stock charts are one of the most important tools in trading. They show price movements over time and help traders make decisions using visual…
-
What Is Stock Market Analysis? Complete Beginner’s Guide (Ucharts)
Stock market analysis is the process of evaluating financial markets, stocks, and price movements to make informed trading and investment decisions. Platforms like Ucharts…
-
How US Traders Pick a Prop Firm in 2026: A Field Guide
Most US-based independent traders who scale beyond a personal account in 2026 do it through a proprietary trading firm, not by compounding their own…
-
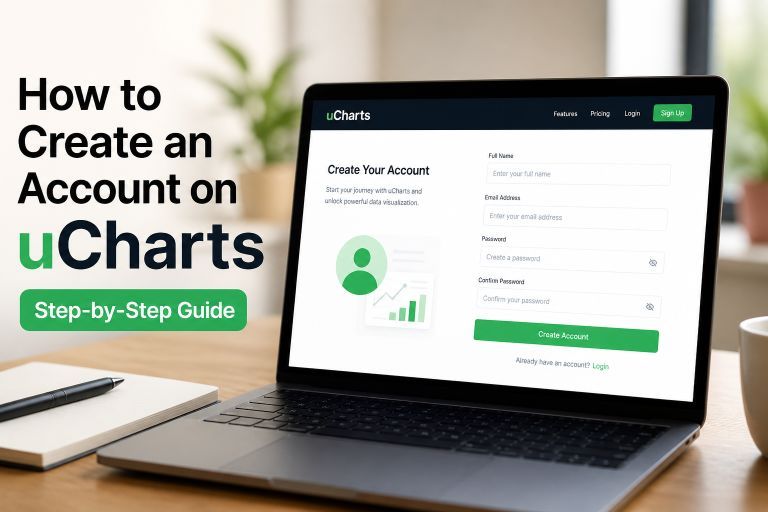
How to Create an Account on uCharts (Step-by-Step Guide)
If you’re looking to explore financial charts or practice trading strategies, the first step is creating an account on uCharts. The platform offers a…
-
Why Order Fulfillment Services Are Essential for Online Retail Success
The demands that customers make of e-tailers in today’s dynamic e-Commerce environment have never been greater. The customer expects fast shipping, accurate delivery, easy…