Introduction to Ucharts: Revolutionizing Data Visualization
Data visualization is an essential tool in today’s world of business intelligence. In an era where data is king, the ability to present it effectively can make all the difference in decision-making processes. Ucharts is here to revolutionize the way we look at data visualization. Whether you’re a business owner, analyst, or data scientist, Ucharts provides an intuitive platform for transforming your raw data into clear, actionable insights. Let’s dive into everything that makes Ucharts stand out from the competition.
What is Ucharts?
Ucharts is a cutting-edge data visualization platform designed to create beautiful and interactive charts that enhance the interpretation of data. With a focus on simplicity and flexibility, Ucharts allows users to present complex datasets in a way that’s visually appealing and easy to understand. This platform is not only user-friendly but also powerful enough to handle vast amounts of data for enterprises and professionals.
The Key Features of Ucharts
Ucharts comes packed with features that cater to both beginners and seasoned data professionals. Some of the standout features include:
- Customizable chart types
- Real-time data integration
- Fully interactive dashboards
- Easy-to-use drag-and-drop interface
Why Choose Ucharts for Your Data Visualization?
If you’ve tried other data visualization tools and found them complicated or limited in terms of flexibility, Ucharts may just be what you’re looking for. Unlike traditional platforms, Ucharts offers user-friendly interfaces that don’t require extensive coding knowledge. It’s suitable for businesses of all sizes and can help streamline data analysis and decision-making.
The Power of Ucharts for Data Analysis
Interactive Charts for Better Data Representation
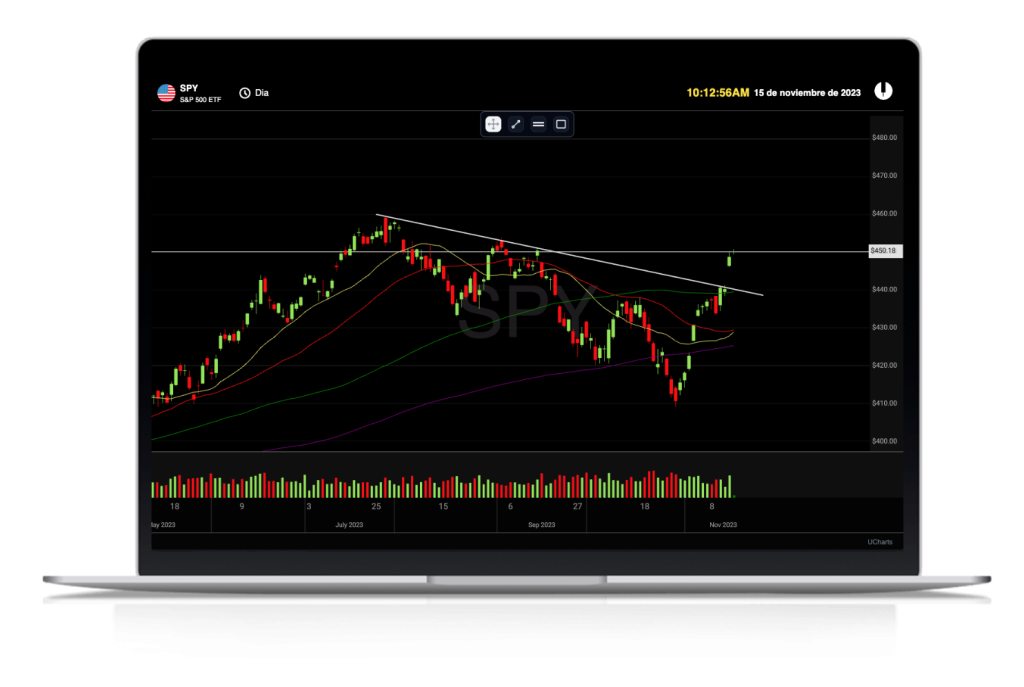
The power of Ucharts lies in its interactive features. Instead of static charts, Ucharts lets users create interactive visualizations that allow them to dig deeper into the data. Whether you’re analyzing website traffic or customer demographics, the ability to interact with the charts makes data much more approachable and insightful.
Real-Time Data Visualization
One of the most impressive aspects of Ucharts is its real-time data visualization capabilities. This feature allows users to see updates as new data comes in. For businesses, this means that they can make decisions based on the most current data available without waiting for hours or days for manual updates.
Easy Integration with Other Platforms
Ucharts makes it easy to integrate with other platforms and databases. Whether you’re pulling data from Google Analytics, Salesforce, or custom APIs, Ucharts can seamlessly sync your data, making it even easier to generate reports and insights.
How Ucharts Improves Your Data-Driven Decisions
Understanding Complex Data through Simplicity
Data can often feel overwhelming, especially when dealing with large sets of complex numbers. Ucharts simplifies this process by turning complicated datasets into visually digestible charts. This visual approach helps businesses and individuals quickly identify trends, outliers, and correlations, making decision-making more efficient.
Making Informed Business Decisions with Ucharts
With Ucharts, businesses can analyze their key performance indicators (KPIs) and metrics in real time. By offering a clear visualization of performance, businesses can adjust strategies on the fly, improving overall effectiveness and success. In industries like marketing, finance, and sales, this capability is invaluable.
Ucharts vs. Competitors: What Makes It Stand Out?
Comparing Ucharts with Google Charts
While Google Charts is a popular tool for data visualization, Ucharts takes the experience to the next level by offering advanced features, a more user-friendly interface, and customizable designs. Unlike Google Charts, Ucharts allows for seamless integration with third-party apps and databases, which gives users even more power to manipulate and present their data.
Ucharts vs. Tableau: A Clear Winner?
Tableau is often considered the industry leader in data visualization. However, Ucharts provides a more affordable alternative for businesses on a budget. While Tableau offers many advanced features, Ucharts focuses on simplicity and user experience, making it ideal for smaller businesses or those just starting with data visualization.
Practical Use Cases for Ucharts
Data Analytics for Marketing
For marketing teams, understanding customer behavior is crucial. Ucharts makes it easy to track metrics like conversion rates, engagement, and social media interactions. By visualizing these data points in real time, marketers can make data-driven decisions that increase campaign effectiveness.
Financial Data Visualization
Ucharts is also highly beneficial in the financial sector. Financial analysts can use Ucharts to visualize income statements, balance sheets, and other financial metrics. With the ability to create customizable charts, financial teams can present their data in a way that is easy to understand, even for non-financial stakeholders.
Social Media Insights and Trends
Social media managers can use Ucharts to track the performance of their campaigns, monitor follower growth, and analyze engagement rates. Ucharts’ ability to pull data from multiple platforms, like Facebook, Instagram, and Twitter, makes it easy to compare social media metrics and adjust strategies accordingly.
How to Get Started with Ucharts
Signing Up and Setting Up Your Ucharts Account
Getting started with Ucharts is a breeze. Simply visit their website and sign up for an account. Once you’ve completed the registration process, you can easily set up your profile and connect your data sources.
Creating Your First Chart with Ucharts
After setting up your account, creating your first chart is simple. Ucharts offers a wide variety of templates and chart types, so you can select the one that fits your needs. From line charts to pie charts, Ucharts makes chart creation easy with a drag-and-drop interface.
Customizing Your Ucharts Visualizations
One of the best things about Ucharts is how customizable it is. You can change colors, labels, and even chart types with just a few clicks. This allows you to create personalized visualizations with an AI logo that match your branding or specific data presentation needs..
Advanced Features of Ucharts for Professionals
Customizable Widgets and Templates
For professional users, Ucharts offers a wide range of advanced features, such as customizable widgets and templates. These tools allow you to create complex dashboards tailored to your specific data needs. Whether you’re building a dashboard for a client or your own team, these features give you the flexibility to display the data that matters most.
Embedded Analytics in Websites and Apps
Ucharts allows you to embed visualizations directly into websites and apps. This feature is ideal for businesses looking to share real-time analytics with their audience or stakeholders.
Enhancing User Experience with Interactive Dashboards
Interactive dashboards are a key component of Ucharts’ offering. By adding features like drill-downs and filtering options, Ucharts enables users to dive deeper into the data and gain more insights from their visualizations.
The Future of Ucharts: What’s Next?
Expected Updates and Enhancements
Ucharts is constantly evolving, and future updates are expected to bring even more advanced features. With a focus on AI-driven data analytics and machine learning, the future of Ucharts looks incredibly promising.
The Impact of AI and Machine Learning on Data Visualization
AI and machine learning will significantly enhance Ucharts’ capabilities, allowing it to analyze data in more intelligent ways. These advancements will allow users to gain insights that were previously not possible with traditional data visualization tools.
Conclusion: Why Ucharts is the Future of Data Visualization
In conclusion, Ucharts offers an intuitive and powerful platform for data visualization that is perfect for businesses of all sizes. With its user-friendly interface, real-time data integration, and advanced customization options, Ucharts is undoubtedly a game-changer in the world of data analysis. Whether you’re a small business owner or a data professional, Ucharts provides the tools you need to make better, more informed decisions based on your data.
FAQs
1. How much does Ucharts cost?
Ucharts offers several pricing plans, depending on the features you need. It has a free plan for basic users and paid plans with more advanced options.
2. Can I integrate Ucharts with my existing data sources?
Yes, Ucharts allows integration with several data sources, including Google Analytics, Salesforce, and custom APIs.
3. Does Ucharts offer customer support?
Yes, Ucharts offers customer support via chat, email, and a knowledge base to help you troubleshoot and maximize your use of the platform.
4. Is it easy to use Ucharts for beginners?
Absolutely! Ucharts is designed to be user-friendly, even for beginners. The drag-and-drop interface makes creating charts and dashboards incredibly simple.
5. Can I embed Ucharts in my website or app?
Yes, Ucharts provides an embed feature that allows you to integrate your charts and dashboards into websites or mobile apps seamlessly.