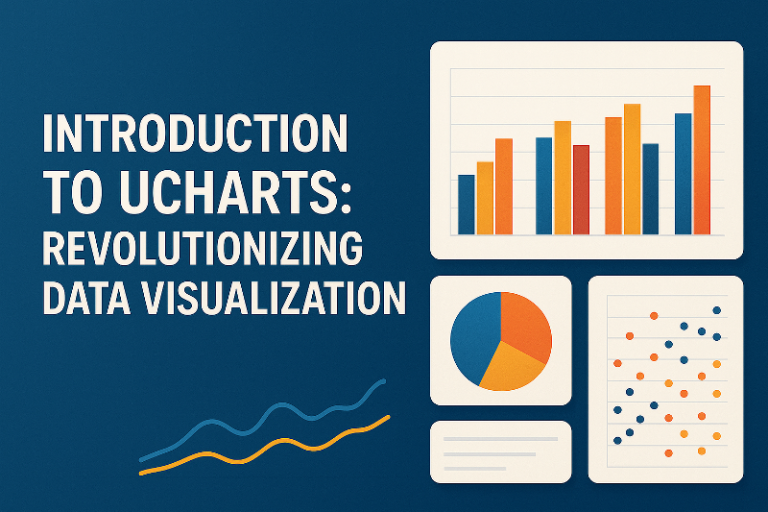
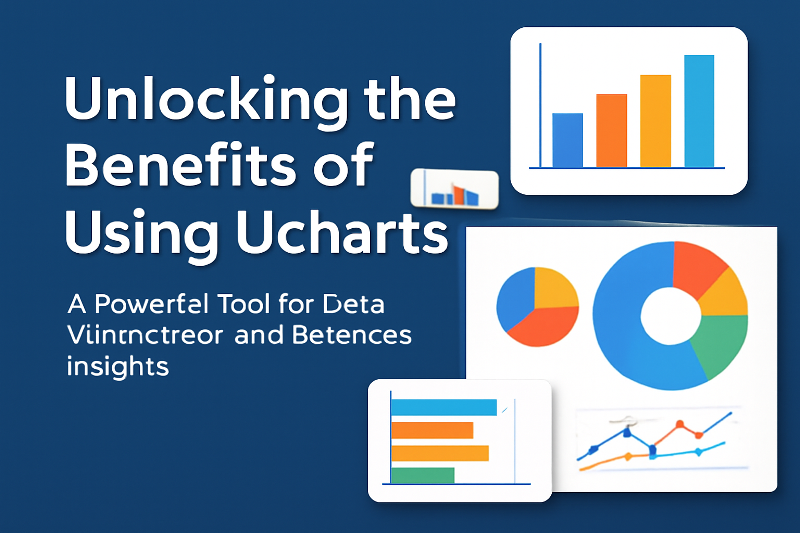
Unlocking the Benefits of Using Ucharts: A Powerful Tool for Data Visualization and Business Insights
In today’s data-driven world, understanding and interpreting data is key to making informed decisions. Whether you’re a business owner, marketer, or student, presenting data in an easy-to-understand format is crucial for conveying your message. This is where Ucharts comes in. But what exactly is Ucharts, and why should you consider it for your data visualization needs? In this article, we’ll explore the benefits of using Ucharts, how it can revolutionize the way you work with data, and why it’s becoming the go-to tool for businesses, marketers, and teams alike.
What is Ucharts?
Ucharts is a dynamic and easy-to-use tool designed for creating visually compelling charts and graphs. It helps users transform raw data into clear, actionable insights by presenting it in a visually appealing format. Whether you’re tracking sales, monitoring marketing campaigns, or analyzing customer behavior, Ucharts allows you to turn complex data into understandable, digestible visuals.
Overview of Ucharts
Ucharts provides a range of chart types that can be customized to fit any need—line charts, bar charts, pie charts, and more. This versatility makes it perfect for professionals across various industries. The platform is designed to be intuitive and user-friendly, which means you don’t need to be a data expert or a programmer to create sophisticated charts.
Key Features of Ucharts
- Customizable Templates: Choose from a wide array of pre-designed templates that can be easily tailored to fit your data’s needs.
- Real-Time Data Updates: Ucharts allows for real-time data integration, ensuring that your charts always reflect the most current information.
- Interactive Elements: Users can create interactive charts, where viewers can hover, click, or drill down to explore more detailed data.
- Cross-Platform Accessibility: Whether you’re working on your desktop or mobile device, Ucharts is fully accessible across various platforms, making it easy to work from anywhere.
How Ucharts Enhances Data Visualization
Presenting data effectively isn’t just about showing numbers—it’s about telling a story. Ucharts excels in making this story come to life with its clean and engaging visuals.
Clear and Concise Data Presentation
The core benefit of using Ucharts is its ability to display data clearly and concisely. Unlike traditional spreadsheets that can be overwhelming with rows and columns of data, Ucharts transforms this information into visually digestible charts, making it easier for you and your audience to understand complex data at a glance.
Visual Storytelling for Better Engagement
A picture is worth a thousand words, and when it comes to data, the same holds true. Ucharts allows you to use compelling visuals that not only showcase the data but also engage your audience in a meaningful way. Whether you’re presenting to colleagues, clients, or stakeholders, these visual tools can drive engagement and make your data-driven narrative much more compelling.
Customization Options for Unique Data Needs
No two datasets are the same, and Ucharts understands this. That’s why the platform offers a high degree of customization. Whether you need to adjust the colors of your chart, change labels, or modify axis options, Ucharts provides the flexibility to tailor your chart according to your unique requirements.
Benefits of Using Ucharts in Business
Ucharts isn’t just about creating pretty charts; it’s about improving your workflow and decision-making process. Here are some key benefits of using Ucharts in a business context.
Improved Decision-Making
Data is only valuable when it informs decisions. With Ucharts, businesses can make better decisions by presenting their data in a way that makes trends, patterns, and insights more obvious. The clarity that Ucharts provides allows decision-makers to act quickly and confidently.
Streamlined Data Analysis
Analyzing data manually can be time-consuming and error-prone. Ucharts simplifies this by providing automatic chart generation based on your raw data, saving you time and effort. You can focus more on interpreting the data rather than figuring out how to present it.
Easy Integration with Other Tools
Ucharts is designed to work seamlessly with other business tools, making it easy to integrate into your existing workflow. Whether you’re using CRM software, Google Analytics, or spreadsheets, Ucharts can pull in data from these platforms to generate real-time visualizations.
User-Friendly Interface: A Game Changer
Ucharts is known for its user-friendly interface, which has been designed with both beginners and experienced users in mind. It eliminates the steep learning curve typically associated with data visualization tools.
Intuitive Design for All Skill Levels
Ucharts provides an intuitive drag-and-drop interface, which allows users to quickly create charts without the need for any technical expertise. This makes it accessible to everyone, whether you’re a business owner looking to create simple sales charts or a data analyst working with more complex datasets.
No Coding Required for Most Features
One of the standout features of Ucharts is that you don’t need to know how to code to use it. While other tools may require some technical skills to generate certain charts, Ucharts allows you to create beautiful visuals with just a few clicks, making it perfect for non-technical users.
Quick Setup and Customization
Setting up charts in Ucharts takes only a few minutes. After importing your data, you can choose your preferred chart style and customize it to meet your needs. The fast setup time allows users to focus on analyzing data instead of spending hours trying to create the perfect visualization.
Boosting Productivity with Ucharts
Time is money, and Ucharts helps businesses save both. Here’s how Ucharts boosts productivity.
Time-Saving Capabilities
With Ucharts, you can create charts in a fraction of the time it would take to manually generate them. Its automation and easy setup mean that users can spend less time creating visuals and more time analyzing the insights that those visuals provide.
Creating Charts in Minutes
Gone are the days of struggling with Excel spreadsheets to create charts. Ucharts allows you to generate stunning charts within minutes, freeing up your time for other important tasks. Its straightforward design means that anyone, regardless of technical expertise, can produce professional-quality charts in no time.
Efficiency in Sharing Data Across Teams
Collaboration is key in any business. Ucharts allows you to easily share your charts with others, whether they are in your immediate team or part of a larger organization. With its sharing options, data is no longer trapped in individual reports; it can be distributed and analyzed by multiple stakeholders.