Fundamental Analysis Basics for Stock Investors
A clear introduction to what fundamental analysis is, the numbers that matter most, and how to use them to judge whether a stock is worth owning.
Fundamental analysis is the practice of evaluating a company’s actual financial health and business quality to judge whether its stock is fairly priced. Unlike technical analysis, which focuses on price patterns, fundamental analysis looks at revenue, profit, debt, and growth — the underlying drivers that determine what a business is genuinely worth over time. This guide breaks down the core building blocks of fundamental analysis in plain language, so you can start applying them to real stocks.
Whether you’re evaluating your first stock or refining a process you’ve used for years, the same basic building blocks apply. Prices, valuations, and market sentiment change constantly, but the underlying questions fundamental analysis asks — is this business profitable, is it growing sustainably, and is it financially stable — stay consistent regardless of market conditions.
What Fundamental Analysis Actually Measures
At its core, fundamental analysis tries to answer one question: what is this business actually worth, based on what it earns and owns, independent of what the market happens to be paying for it today? Analysts look at a company’s financial statements, its competitive position, and broader economic conditions to build an informed view of its true value.
This differs meaningfully from simply following price trends. A stock can rise for weeks purely on speculation or hype, disconnected from anything happening in the underlying business. Fundamental analysis is the discipline that keeps you anchored to the actual company, rather than the mood of the market around it.
Top-Down vs. Bottom-Up Analysis
Some investors start broad — looking at the overall economy and specific sectors before narrowing down to individual companies. This is called a top-down approach. Others start with an individual company they already find interesting and work outward from there, known as bottom-up analysis. Beginners often find bottom-up analysis easier, since it starts with something concrete rather than abstract macroeconomic trends.
Neither approach is inherently better — many experienced investors use a blend of both, narrowing sectors broadly while still evaluating individual companies on their own specific merits before making a final decision.
The Three Core Financial Statements
Every publicly traded company is required to publish financial statements, and these form the backbone of fundamental analysis. Understanding what each one shows is essential before moving on to ratios or valuation.
These statements are typically released quarterly and summarized annually. Reading them side by side across several periods, rather than in isolation, is what actually reveals meaningful trends — a single quarter rarely tells the full story on its own.
Income Statement
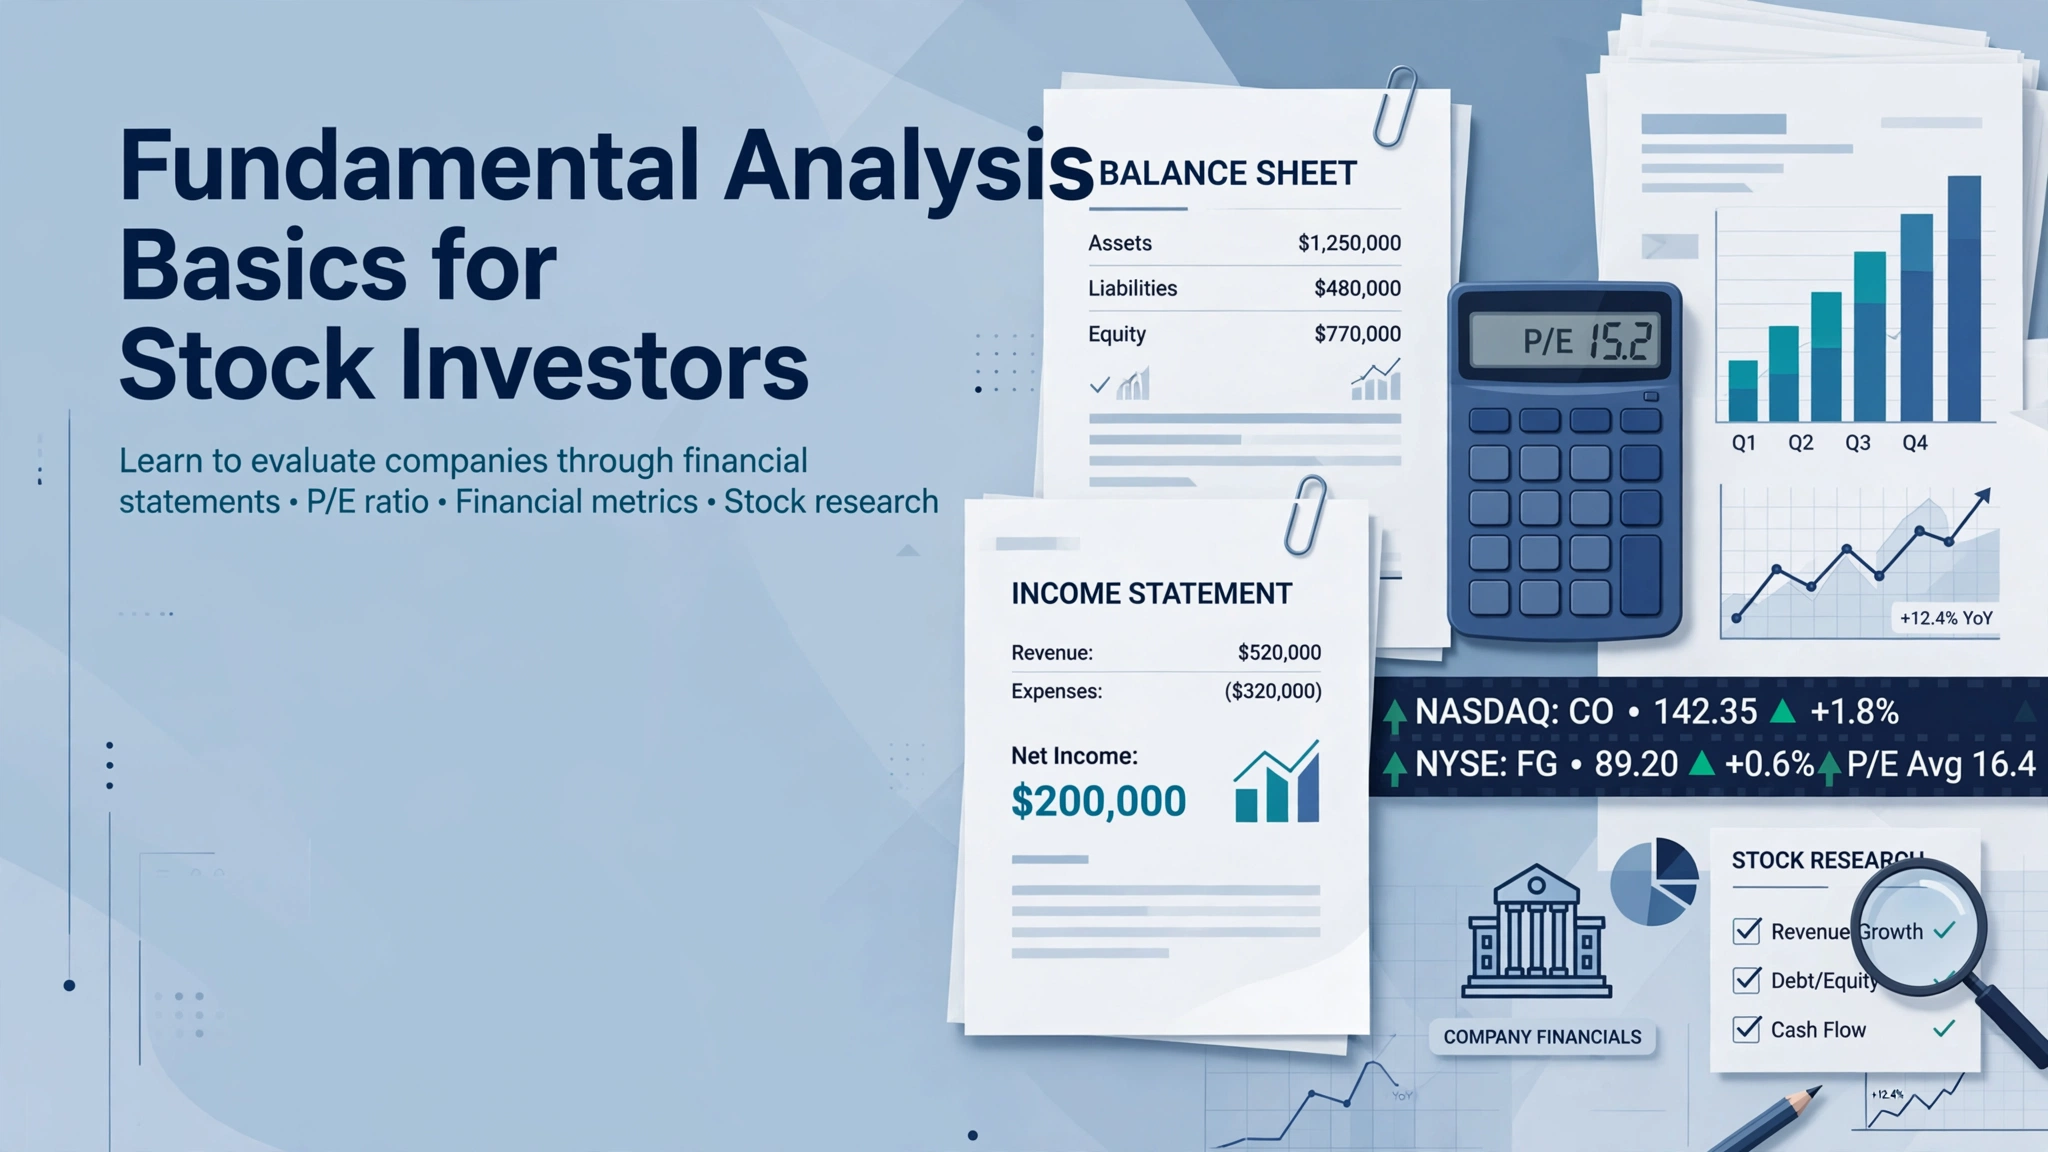
Shows revenue, expenses, and profit over a specific period. Reveals whether the business is actually making money.
Balance Sheet
A snapshot of assets, liabilities, and equity at a point in time. Reveals financial stability and debt load.
Cash Flow Statement
Tracks actual cash moving in and out. Reveals whether reported profit translates into real cash generation.
Notes & Disclosures
Additional context behind the numbers — accounting methods, risks, and one-off items worth understanding.
Key Ratios Every Beginner Should Know
Ratios turn raw financial figures into comparable metrics, letting you evaluate a company against its own history and its industry peers.
No single ratio tells the whole story, and relying on just one is a common beginner mistake. A low valuation ratio paired with weak profitability, for instance, isn’t necessarily a bargain — it may simply reflect a business the market has correctly priced as struggling.
Valuation Ratios
The price-to-earnings (P/E) ratio compares a stock’s price to its earnings per share, showing how much investors are paying for each dollar of profit. The price-to-book (P/B) ratio compares price to the company’s net asset value. Both are most useful when compared against similar companies rather than judged alone.
Profitability Ratios
Return on equity (ROE) measures how efficiently a company turns shareholder capital into profit. Net profit margin shows how much of each dollar in revenue actually becomes profit after all expenses. Companies with consistently strong profitability ratios often have a genuine competitive advantage.
Debt and Liquidity Ratios
The debt-to-equity ratio shows how much of the company is financed through borrowing versus shareholder capital. The current ratio measures whether short-term assets comfortably cover short-term liabilities. These matter most during economic slowdowns, when highly leveraged companies tend to feel the pressure first.
| Ratio | What It Shows | Category |
|---|---|---|
| P/E Ratio | Price paid per dollar of earnings | Valuation |
| Return on Equity | Profit generated per dollar of shareholder capital | Profitability |
| Debt-to-Equity | Reliance on borrowed money | Financial health |
| Current Ratio | Ability to cover short-term obligations | Liquidity |
Growth Signals Worth Tracking
Beyond a single snapshot, fundamental analysis pays close attention to trends over multiple periods. A company growing revenue and profit consistently, quarter after quarter, tells a very different story than one with a single strong quarter surrounded by inconsistent results.
Investors sometimes get excited about a single standout quarter without checking whether it fits a broader pattern. A company that beats expectations once after several disappointing periods deserves more scrutiny than one delivering steady, if less dramatic, improvement over time.
- Revenue growth rate. Consistent, sustainable growth is generally more valuable than a single explosive quarter driven by a one-off event.
- Margin trend. Expanding margins alongside revenue growth often signal improving efficiency or pricing power.
- Earnings consistency. Frequent large surprises, in either direction, can indicate unpredictable or poorly guided operations.
- Reinvestment pattern. How a company reinvests profit — into growth, debt reduction, or shareholder returns — reveals management’s priorities.
Macroeconomic Factors That Influence Fundamentals
No company operates in isolation. Interest rates, inflation, and broader economic growth all influence how a business performs and how investors value it. Rising interest rates, for example, tend to pressure highly indebted companies more than those with strong balance sheets, since borrowing costs increase directly.
Sector sensitivity to macro conditions also varies widely. Consumer discretionary companies, for instance, tend to feel the effects of a slowing economy faster than utility or healthcare companies, whose demand remains relatively stable regardless of broader economic cycles. Knowing where a company sits within this spectrum helps set realistic expectations for how it might perform during different economic phases.
Tracking a few key macro indicators alongside company-specific research gives a more complete picture. Reliable, publicly available economic data — such as interest rates, inflation, and employment figures — can be found through resources like the Federal Reserve Economic Data (FRED) database, which is maintained independently of any brokerage or trading platform.
Combining Fundamentals with Chart Context
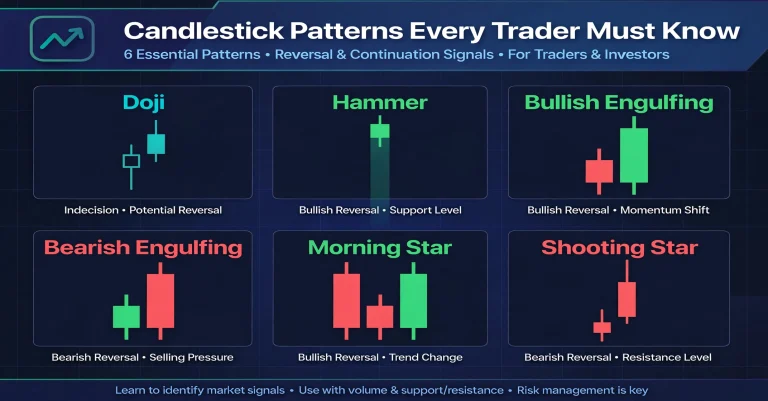
Fundamental analysis tells you whether a business is sound; it doesn’t tell you the best moment to buy. Many experienced investors pair fundamental research with a basic read of the price chart before deciding on entry timing. Recognizing simple candlestick signals near key price levels, for instance, can add useful confirmation once you’ve already decided a company is fundamentally worth owning.
This combination matters because even a strong company can be bought at a poor moment. A stock that has already risen sharply on strong fundamentals may still be due for a pause or pullback, and waiting for a more reasonable entry point rarely costs much in the context of a long-term investment.
If you’re new to reading charts, our guide on how to read candlestick charts for beginners walks through the basics in plain language, and pairs naturally with the fundamental framework covered here.
Common Mistakes Beginners Make
- Judging a ratio in isolation. A low P/E can mean undervalued, or it can mean the market has correctly priced in real problems — context matters.
- Ignoring cash flow. Reported profit can be shaped by accounting choices; cash flow is much harder to disguise.
- Overweighting a single quarter. One strong or weak quarter rarely tells the full story on its own.
- Skipping the macro picture. Broader economic conditions can move even a well-run company’s stock significantly in the short term.
- Never verifying against primary sources. Always cross-check important figures against a company’s actual filings rather than relying on secondhand summaries.
For definitive company-level financial data, official filings remain the most reliable source. In the United States, these are publicly accessible through the U.S. Securities and Exchange Commission, which maintains disclosure records independent of any trading platform or brokerage.
Building a Simple Fundamental Analysis Routine
You don’t need to analyze every ratio in existence for every stock you consider. A simple, repeatable routine tends to work better than an exhaustive one you’re unlikely to follow consistently.
- Read the company’s most recent income statement and check the revenue and margin trend over the last several quarters.
- Check the balance sheet for debt levels relative to equity and cash on hand.
- Confirm operating cash flow is positive and reasonably consistent.
- Compare one or two valuation ratios against the company’s history and its closest peers.
- Note any relevant macro conditions that could affect the sector in the near term.
Bringing It All Together
Fundamental analysis gives you a grounded way to judge what a business is actually worth, rather than reacting to price movement alone. Start with the financial statements, apply a handful of core ratios, watch the growth trend over multiple periods, and stay aware of the broader economic backdrop — this foundation applies to nearly every stock you’ll ever research.
Like most useful skills, this gets faster with repetition. The first few companies you analyze this way will take real time and effort, but the process becomes second nature once you’ve applied it consistently across a handful of different stocks and industries.
Once you’re comfortable with the fundamentals, pair this analysis with chart context by reviewing how to read candlestick charts for beginners, and use the Position Size Calculator to size your position responsibly before investing.