Best Metrics for Evaluating Stocks (P/E, EPS, ROE Explained)
A practical breakdown of the three metrics every investor checks first — what they mean, how to calculate them, and where they can mislead you.
Picking a stock by “gut feeling” or a hot tip is how most beginners lose money. Professional investors, on the other hand, lean on a small set of financial ratios that tell them, in seconds, whether a company is cheap or expensive, profitable or struggling, and efficient or wasteful with shareholder money. Three of these ratios — the Price-to-Earnings ratio (P/E), Earnings Per Share (EPS), and Return on Equity (ROE) — form the backbone of almost every stock evaluation. This guide explains what each one means, how it is calculated, and just as importantly, where it can lead you astray if used alone.
Why Metrics Matter When Evaluating a Stock
A stock price by itself tells you almost nothing. A $10 stock is not “cheaper” than a $500 stock; what matters is the price relative to what the company actually earns, owns, and produces for shareholders. Metrics like P/E, EPS, and ROE translate raw financial statements into numbers you can compare across companies, sectors, and time periods. Used correctly, they help you avoid two common traps: overpaying for a popular company, and underestimating a quietly profitable one.
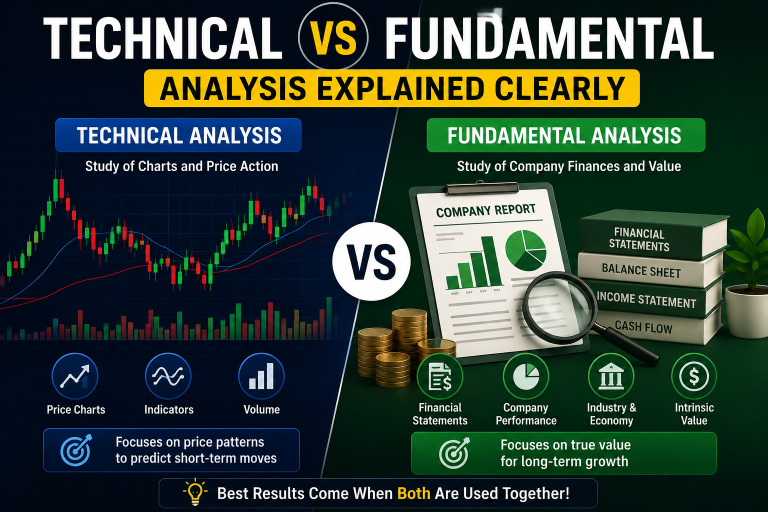
Before diving into the ratios themselves, it helps to already understand how prices move on a chart, since ratios are only half the picture — price action and volume fill in the rest. If you have not yet reviewed the basics, our guide on what a stock chart is and how it works is a good companion read before you start comparing company fundamentals.
Price-to-Earnings Ratio (P/E)
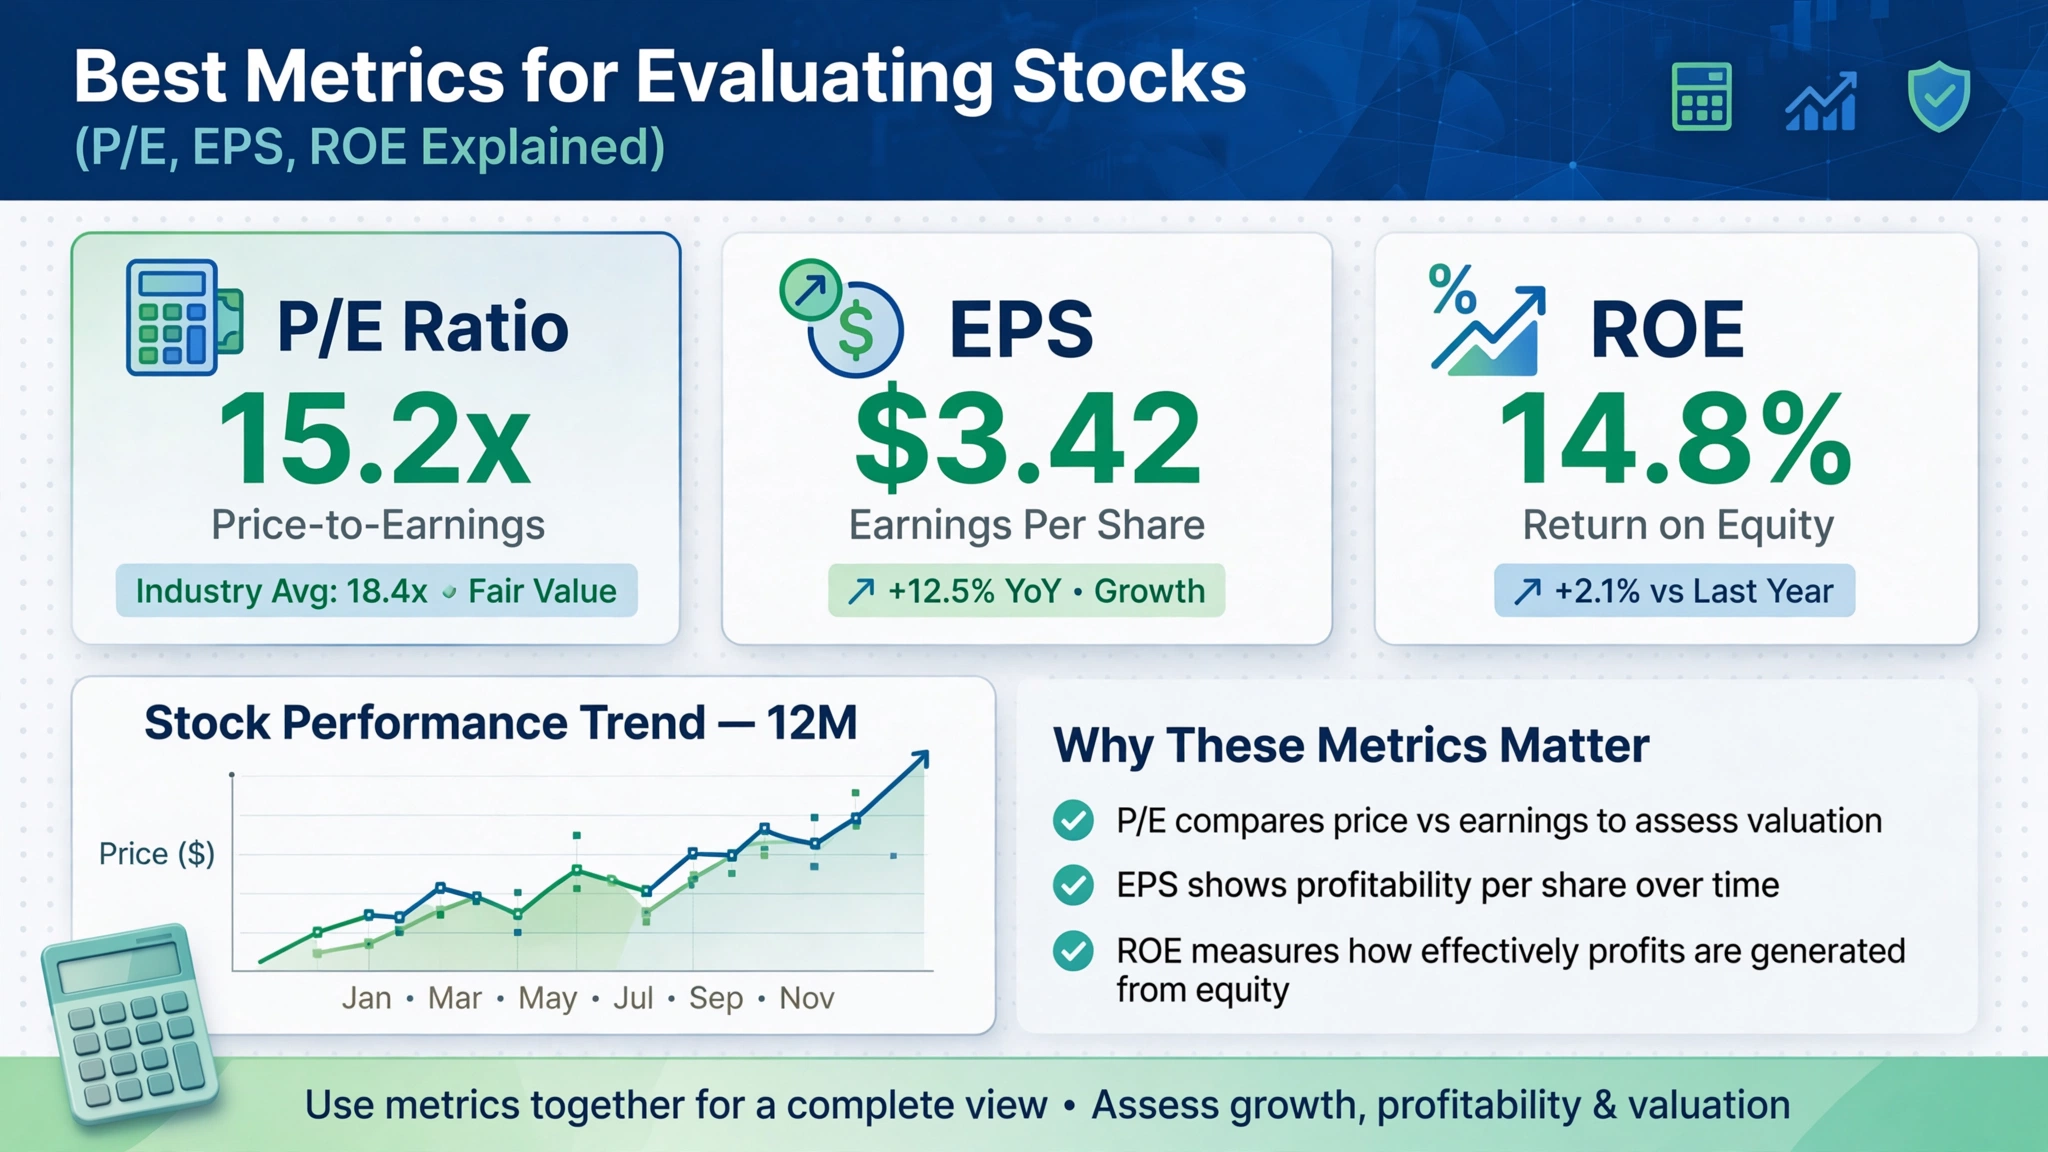
The P/E ratio is the most quoted valuation metric in the stock market. It answers a simple question: how much are investors willing to pay today for every dollar of a company’s earnings?
How to Read a P/E Number
If a stock trades at $60 and its EPS is $4, the P/E ratio is 15. That means investors are paying $15 for every $1 of annual profit the company generates. A higher P/E usually signals that the market expects faster future growth, while a lower P/E can mean the stock is undervalued — or that the market has doubts about the company’s prospects.
Trailing vs Forward P/E
There are two common versions of this ratio. Trailing P/E uses earnings from the past twelve months, which is factual but backward-looking. Forward P/E uses analyst estimates for the next twelve months, which is more relevant for growth investing but depends on projections that can be wrong. Comparing both versions side by side often reveals whether the market expects earnings to accelerate or decelerate.
Limitations of the P/E Ratio
- It is meaningless for companies with no earnings, such as early-stage growth companies still posting losses.
- It varies wildly by industry — a software company and a utility company should never be judged on the same P/E scale.
- It can be distorted by one-time events like asset sales or write-offs that temporarily inflate or shrink earnings.
- A low P/E is not automatically a “buy” signal; sometimes the market is correctly pricing in real trouble ahead.
Quick tip: Always compare a company’s P/E to its own historical average and to direct competitors in the same sector, not to the broad market index.
Earnings Per Share (EPS)
EPS measures how much profit a company generates for each outstanding share of stock. It is the building block behind the P/E ratio and one of the first numbers analysts check on any earnings report.
Basic EPS vs Diluted EPS
Basic EPS uses the current number of shares outstanding. Diluted EPS accounts for shares that could be created in the future through stock options, convertible bonds, or warrants. Diluted EPS is almost always slightly lower, and it gives a more conservative, realistic view of profitability per share, especially for companies that issue a lot of employee stock compensation.
Why EPS Growth Matters More Than the Absolute Number
A single EPS figure is far less useful than its trend. A company growing EPS by 15% a year consistently is usually rewarded with a higher valuation over time, while flat or declining EPS often drags a stock price down even if the company still looks “profitable” on paper. When you evaluate a stock, look at EPS over the last five years, not just the most recent quarter.
Watch Out for Buyback-Driven EPS Growth
Companies can boost EPS simply by buying back their own shares, which reduces the share count in the denominator without any real improvement in the underlying business. This can make EPS growth look stronger than actual operational performance. Always check whether EPS growth is coming from more profit or from fewer shares.
Return on Equity (ROE)
ROE measures how efficiently a company turns shareholder money into profit. It is the metric most favored by long-term, quality-focused investors because it captures management’s ability to generate returns from the capital it has been given.
What Counts as a “Good” ROE
There is no universal number, but as a general reference point, an ROE consistently above 15% is often considered strong, while anything below 10% may suggest inefficient use of capital — though this varies heavily by industry. Banks and asset-heavy sectors typically run lower ROEs than software or consumer brand companies with lighter balance sheets.
| Metric | What It Measures | Best Used For |
|---|---|---|
| P/E Ratio | Price relative to earnings | Valuation comparisons |
| EPS | Profit per share | Tracking profitability trends |
| ROE | Efficiency of capital use | Judging management quality |
The Debt Trap Behind a High ROE
A company can artificially inflate its ROE by taking on heavy debt, which shrinks the equity base in the denominator rather than genuinely improving profitability. This is why ROE should always be checked alongside a company’s debt-to-equity ratio. A high ROE built on a mountain of debt is a very different, riskier story than a high ROE built on strong cash generation and little leverage.
Other Metrics Worth Knowing
P/E, EPS, and ROE form the foundation, but a well-rounded evaluation usually pulls in a few supporting numbers as well:
- Price-to-Book (P/B) Ratio: Compares share price to the company’s net asset value, useful for asset-heavy businesses like banks and industrials.
- Debt-to-Equity Ratio: Reveals how much of the company’s operations are financed by debt versus shareholder equity.
- Dividend Yield: Shows the annual dividend as a percentage of share price, important for income-focused investors.
- Free Cash Flow (FCF): Cash actually generated after capital expenditures, often considered harder to manipulate than net income.
Putting the Metrics Together: A Simple Framework
No single ratio tells the full story, and relying on just one is how many investors get trapped by “value traps” or overhyped growth stories. A more reliable approach is layering the metrics together:
- Start with EPS trends to confirm the company is genuinely growing profit, not just share count shrinking.
- Check the P/E ratio against sector peers to see if the current price already reflects that growth.
- Confirm with ROE and debt levels that the profit is being generated efficiently, not through excessive leverage.
- Cross-reference with the price chart to see whether the market has already priced in the fundamentals, or whether there is a gap worth investigating.
Manage the risk side too: Strong fundamentals do not remove the need for proper position sizing. Before acting on any stock idea, run the numbers through our free Risk Reward Calculator to make sure the trade still makes sense even if the thesis takes time to play out.
Real-World Example: Comparing Two Companies
Numbers make more sense side by side. Imagine two fictional companies in the same retail sector, Company A and Company B, both trading at $50 per share.
| Metric | Company A | Company B |
|---|---|---|
| EPS | $2.00 | $5.00 |
| P/E Ratio | 25 | 10 |
| ROE | 22% | 8% |
| Debt-to-Equity | 0.4 | 1.6 |
On the surface, Company B looks like the obvious bargain — a P/E of 10 versus 25, and a higher EPS too. But once ROE and debt are added into the picture, the story flips. Company A is generating a much stronger return on every dollar of shareholder equity, and it is doing so with far less leverage. Company B’s higher EPS and lower P/E could simply be a reflection of a mature, slower-growing, more debt-financed business rather than a genuine bargain. This is exactly why relying on a single ratio in isolation is risky: the “cheaper” stock on paper is not necessarily the better investment once profitability and balance sheet health are factored in.
This kind of side-by-side comparison is also where sector context becomes critical. A P/E of 25 might be perfectly reasonable for a company growing revenue at 20% a year, while the same P/E could be a red flag for a company with flat or shrinking sales. Numbers only become meaningful once they are placed next to a peer group and a growth story.
Frequently Asked Questions
Is a lower P/E ratio always better?
Not necessarily. A low P/E can reflect a genuine bargain, but it can also reflect a company the market expects to struggle. Always check earnings trends and industry context before assuming a low P/E means “cheap and safe.”
What is considered a strong EPS growth rate?
There is no fixed number, but consistent double-digit annual EPS growth over several years is generally viewed as strong, provided it is driven by real profit growth rather than share buybacks alone.
Can ROE be misleading?
Yes. A company can inflate ROE through heavy borrowing rather than genuine operational efficiency, which is why ROE should always be checked alongside the debt-to-equity ratio before drawing conclusions.
Should beginners rely on just one metric?
No. Each metric answers a different question, and using them together — alongside a look at the price chart — gives a far more complete and reliable picture than any single number on its own.
Common Mistakes When Using These Metrics
- Comparing P/E ratios across completely different industries.
- Chasing a low P/E without checking whether earnings are declining for a real, fundamental reason.
- Treating EPS growth as good news without checking whether it came from buybacks rather than actual business growth.
- Ignoring debt levels when a company shows an unusually attractive ROE.
- Using a single quarter’s numbers instead of looking at a multi-year trend.
External Resources for Further Reading
If you want to dig deeper into the accounting definitions behind these ratios straight from a regulatory source, the U.S. Securities and Exchange Commission’s investor education portal, Investor.gov, maintains a plain-English glossary of financial terms used in company filings. For a deeper academic grounding in financial statement analysis, the CFA Institute Research library offers free primers written for both students and working analysts.
Conclusion
P/E, EPS, and ROE are not magic numbers that spit out a “buy” or “sell” signal on their own. They are lenses — each one showing a different angle of the same company. P/E tells you what the market is willing to pay, EPS tells you how much profit is actually being made per share, and ROE tells you how efficiently that profit is being generated. The investors who consistently make better decisions are not the ones who know the most ratios; they are the ones who know how to read these three together, question what is driving the numbers, and confirm the story with the price chart before committing capital.
This article is for educational purposes only and does not constitute personalized investment advice. Always do your own research or consult a licensed financial advisor before making investment decisions.