Technical vs Fundamental Analysis Explained Clearly
A practical, no-fluff comparison of the two core methods traders and investors use to make decisions — what each one measures, when to use them, and how they work better together.
In This Article
- What Is Fundamental Analysis?
- What Is Technical Analysis?
- Key Differences Between the Two
- Pros and Cons of Each Approach
- Who Uses Which Method?
- Combining Technical and Fundamental Analysis
- Tools and Resources for Each Method
- How Market Conditions Affect Each Approach
- Common Mistakes Beginners Make
- Frequently Asked Questions
Every trader and investor eventually runs into the same question: should decisions be based on the numbers behind a company, or the patterns on the price chart? This is the heart of the debate between fundamental analysis and technical analysis. Both are legitimate, widely used approaches, but they answer different questions, use different data, and suit different types of market participants.
In this guide, we’ll break down exactly what each method involves, how they differ in practice, and how many successful traders end up blending both instead of picking just one side.
What Is Fundamental Analysis?
Fundamental analysis is the study of a company’s or asset’s intrinsic value. Instead of looking at price movement, fundamental analysts examine the underlying business or economic factors that determine whether an asset is undervalued, overvalued, or fairly priced.
Core Components of Fundamental Analysis
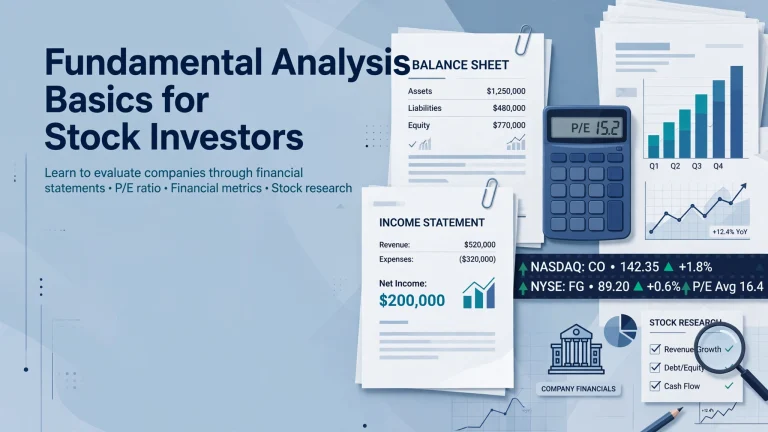
- Financial statements: Income statements, balance sheets, and cash flow reports reveal profitability, debt levels, and operational efficiency.
- Valuation ratios: Metrics like P/E ratio, P/B ratio, and EPS growth help compare a company’s price to its actual performance.
- Macroeconomic factors: Interest rates, inflation, GDP growth, and employment data all influence broader market direction.
- Industry and competitive position: Market share, management quality, and competitive moat matter just as much as the numbers on a spreadsheet.
Fundamental analysis is the backbone of long-term investing. Investors who buy and hold stocks for years — rather than trade short-term price swings — rely heavily on this approach to decide what to own and at what price it becomes attractive. It also plays a role in stock selection, which ties closely into broader market forces. Our breakdown of the top factors that influence stock prices goes deeper into how earnings, sentiment, and economic data move valuations over time.
In short: Fundamental analysis asks “what is this asset actually worth?” It’s slower, research-heavy, and built for medium-to-long-term decisions.
What Is Technical Analysis?
Technical analysis takes a completely different approach. Instead of studying a company’s financial health, it studies price action, volume, and chart patterns to predict where price is likely to go next. The core assumption behind technical analysis is that all known information is already reflected in the price, and that price tends to move in identifiable patterns because of collective trader psychology.
Core Components of Technical Analysis
- Price charts: Candlestick, line, and bar charts show how price has moved over time across different timeframes.
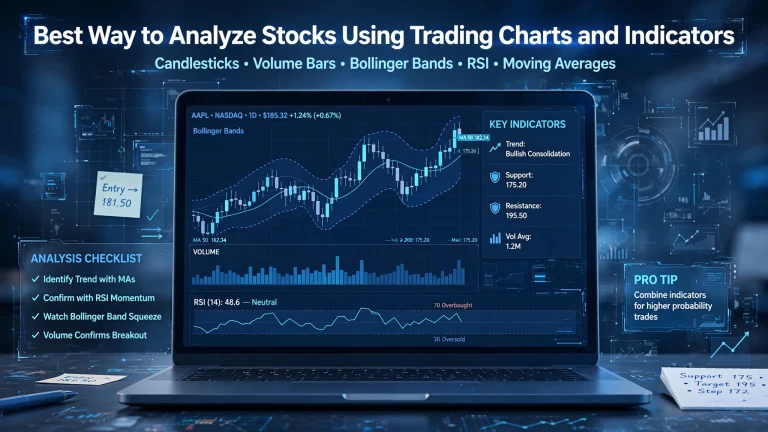
- Indicators and oscillators: Tools like moving averages, RSI, MACD, and Bollinger Bands help identify momentum, trend strength, and potential reversals.
- Support and resistance levels: Price zones where buying or selling pressure has historically caused reversals or breakouts.
- Volume analysis: Trading volume confirms whether a price move has strong participation or is likely to fade.
Technical analysis is especially popular among short-term traders, day traders, and swing traders who need to make decisions quickly without waiting for quarterly earnings reports. If you want a deeper look at how traders read raw price behavior without relying on lagging indicators, our guide on understanding price action in trading walks through the practical side of this approach.
In short: Technical analysis asks “where is price likely to go next based on past patterns?” It’s faster, chart-driven, and built for short-to-medium-term timing.
Key Differences Between the Two
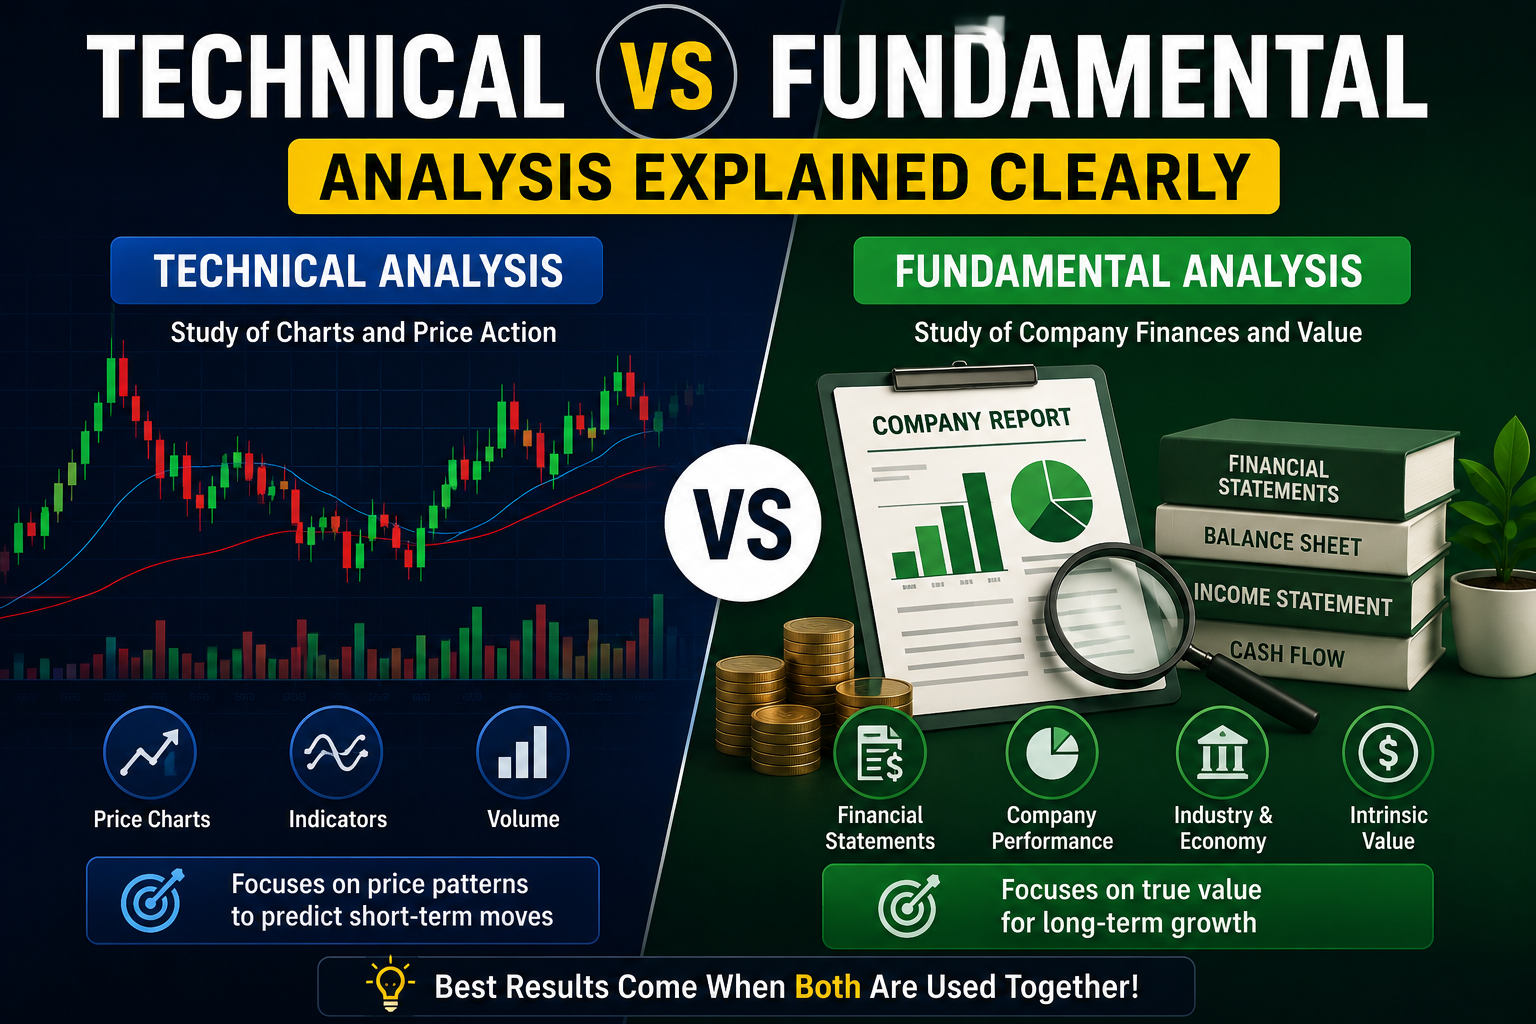
While both methods aim to help traders make profitable decisions, they diverge in almost every practical way. The table below summarizes the core differences.
| 🏷️ Aspect | 📊 Fundamental Analysis | 📈 Technical Analysis |
|---|---|---|
| Primary Focus | Intrinsic value of the asset | Price movement and patterns |
| Data Used | Earnings, revenue, ratios, economic data | Charts, indicators, volume |
| Time Horizon | Medium to long-term | Short to medium-term |
| Goal | Determine if an asset is fairly priced | Time entries and exits |
| Best Suited For | Investors, value-oriented traders | Day traders, swing traders |
Pros and Cons of Each Approach
Fundamental Analysis: Pros
- Provides a deeper understanding of what you actually own
- Helps avoid overpaying for hyped, overvalued assets
- Well-suited for long-term wealth building and portfolio construction
Fundamental Analysis: Cons
- Time-consuming and requires research skills
- Doesn’t help with precise entry or exit timing
- Markets can stay irrational longer than the fundamentals suggest
Technical Analysis: Pros
- Works across virtually any market — stocks, forex, crypto, commodities
- Useful for identifying short-term entry and exit points
- Can be applied without deep knowledge of a company’s business model
Technical Analysis: Cons
- Patterns can fail, especially during unexpected news events
- Can lead to overtrading if not paired with discipline and risk management
- Indicators often lag behind actual price movement
Who Uses Which Method?
In practice, the choice between technical and fundamental analysis often comes down to trading style and time horizon rather than which method is objectively “better.”
- Long-term investors — such as those building retirement portfolios — lean almost entirely on fundamentals, since they care about business quality over years, not daily price swings.
- Swing traders — holding positions for days to weeks — often blend both, using fundamentals to pick the asset and technicals to time the trade.
- Day traders and scalpers — operating on minutes to hours — rely almost entirely on technical analysis, since fundamentals rarely shift meaningfully within a single trading session.
Combining Technical and Fundamental Analysis
Rather than treating these two methods as competitors, many experienced traders treat them as complementary tools. A common workflow looks like this:
- Use fundamentals to build a watchlist. Screen for companies or assets with strong financial health, reasonable valuations, and positive long-term outlooks.
- Use technicals to time entries. Once a fundamentally sound asset is identified, chart analysis helps determine a favorable entry point, rather than buying at a random moment.
- Manage risk with structured position sizing. Regardless of which analysis method led to the trade, proper risk management determines whether a good idea turns into a profitable outcome. Tools like a risk-reward calculator help quantify whether a setup is even worth taking before capital is committed.
This blended approach tends to reduce the weaknesses of relying on just one method. Fundamentals alone can leave you holding a great company through a prolonged price decline, while technicals alone can put you into a position with no real understanding of why the asset should perform well in the first place.
Tools and Resources for Each Method
Both approaches benefit from having the right tools rather than relying purely on manual guesswork.
For Fundamental Analysis
- Company earnings reports and investor relations pages
- Economic calendars for interest rate decisions and inflation data
- Valuation screeners that filter stocks by P/E, debt ratios, and growth metrics
For Technical Analysis
- Charting platforms with customizable indicators and drawing tools
- Volume and volatility overlays to confirm trend strength
- Position sizing and pip calculators to translate chart setups into actual trade parameters
For readers who want an authoritative, plain-language primer on financial statement analysis, the U.S. Securities and Exchange Commission’s investor education portal offers a solid, unbiased starting point at investor.gov. Similarly, if you want to go deeper into financial ratio theory from an academic and corporate finance perspective, Corporate Finance Institute publishes detailed, free breakdowns of standard valuation methods.
How Market Conditions Affect Each Approach
Neither technical nor fundamental analysis works equally well in every market environment. Understanding when each approach tends to shine — and when it tends to struggle — can help you avoid relying too heavily on one method at the wrong time.
Trending Markets
In strongly trending markets, technical analysis tends to perform well because price patterns like higher highs, higher lows, and moving average crossovers are easier to identify and follow. Fundamental analysis still matters here, since a genuine trend is often backed by real earnings growth or improving economic conditions, but the day-to-day trading decisions are usually driven by chart signals rather than fresh financial data.
Range-Bound or Choppy Markets
When price moves sideways without a clear direction, technical indicators can generate false signals more frequently, leading to whipsaws and premature entries. This is often when fundamental analysis becomes more valuable, since it can help traders and investors avoid reacting to short-term noise and instead focus on whether the underlying value proposition of an asset has actually changed.
High-Volatility or News-Driven Markets
During earnings season, central bank announcements, or major geopolitical events, both approaches face challenges. Technical patterns can break down instantly when unexpected news hits, while fundamentals can shift quickly based on new information that wasn’t previously priced in. In these conditions, many experienced traders reduce position sizes and widen their risk tolerance rather than fully trusting either method until volatility settles.
Takeaway: Matching your analysis method to current market conditions — rather than applying the same approach regardless of environment — is one of the more underrated skills separating experienced traders from beginners.
Common Mistakes Beginners Make
- Treating one method as “the truth.” Neither approach guarantees results — both are probability-based tools, not certainties.
- Ignoring risk management entirely. Even a perfect analysis can lose money without proper stop-losses and position sizing.
- Overloading charts with indicators. Too many technical indicators often create conflicting signals rather than clarity.
- Chasing news without checking fundamentals. Reacting to headlines without understanding the underlying financial context often leads to poor entries.
- Skipping backtesting. Whether trading on fundamentals or technicals, testing an approach against historical data builds confidence and highlights weaknesses early.
Frequently Asked Questions
Which is better: technical or fundamental analysis?
Neither is universally “better” — it depends on your trading timeframe. Long-term investors typically favor fundamentals, while short-term traders lean on technicals. Many successful market participants use both together.
Can beginners use both methods at the same time?
Yes, though it’s often easier to build a solid foundation in one method first, then layer in the other. Starting with basic price action and simple valuation metrics tends to work well for most beginners.
Does technical analysis work in the crypto market?
Yes, technical analysis is widely used in crypto trading since digital assets often move on sentiment and momentum. However, fundamentals like tokenomics, adoption metrics, and network activity still matter for longer-term positions.
How long does it take to learn fundamental analysis?
Understanding the basics — reading financial statements and key ratios — can take a few weeks of consistent study. Developing genuine skill in valuing companies accurately typically takes months to years of practice.