Understanding Price Action in Trading (Simple Breakdown)
No lagging indicators, no clutter — just candles, structure, and the levels that actually move price. Here’s price action explained in plain language, from the first candle to a full trading plan.
Most beginners try to learn trading backwards. They install ten indicators, hunt for a “perfect” signal, and get lost the moment two of those indicators disagree with each other. Price action flips that around: instead of decorating the chart, you read the candles themselves — where price has been, where it paused, and where it’s likely to react next.
It sounds almost too simple to work. But strip away the noise and every other form of technical analysis — moving averages, oscillators, volume profiles — is really just a different lens on the same raw material: price. Learn to read that raw material directly, and everything else becomes a confirmation tool instead of a crutch.
This guide breaks price action down into the handful of ideas that actually matter, in plain language, with nothing extra bolted on.
What Is Price Action, Really?
Price action is simply the movement of an asset’s price plotted over time, read directly from the candles instead of through a derived indicator. Every candle already contains four facts: where price opened, where it closed, and the highest and lowest point it touched in between. Read enough candles in sequence and you can see who’s in control — buyers or sellers — without anything else on the chart.
That’s the whole premise: the chart is the data. Indicators are just different ways of smoothing or summarizing that same data, usually a few candles after the fact. If you want a deeper technical breakdown of exactly how a candle’s body and wicks are constructed, CME Group’s education library covers the mechanics well — it’s a good companion read once you’ve got the basics here.
Price action isn’t a single indicator or a magic setup. It’s closer to a reading skill — the same way a sailor reads waves or a mechanic reads an engine by sound. The more charts you look at with this lens, the faster the patterns start to feel obvious instead of random.
Why Traders Lean on Price Action Over Indicators
Indicators aren’t useless, but most are built from past prices, which means they always lag a little behind what’s actually happening right now. A moving average needs several closed candles before it turns. An oscillator can stay “overbought” for days during a strong trend. Price action trades off the live edge of the chart instead, so there’s nothing left to catch up.
| Price Action | Indicator-Based |
|---|---|
| Reacts to what price is doing right now | Reacts after the data has already moved |
| Works the same across stocks, forex, and crypto | Often needs re-tuning per market or timeframe |
| One clean chart, fewer decisions | Easy to overload with conflicting signals |
| Requires practice reading structure | Easier to start, harder to trust blindly |
Indicators can support a price action read — they shouldn’t replace it. Use structure first, indicators second.
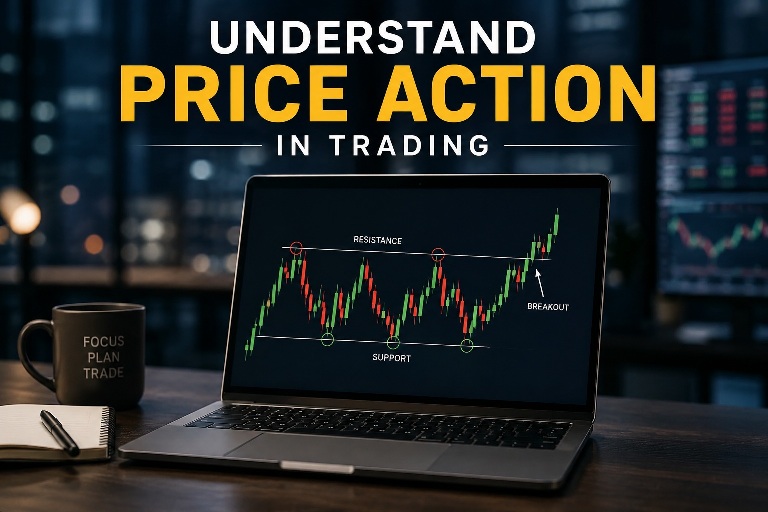
Reading Market Structure: Highs, Lows, and Trend
Before anything else, price action traders ask one question: is the market making higher highs and higher lows (uptrend), lower highs and lower lows (downtrend), or bouncing sideways between the same two levels (range)? The hero chart above shows the first case — every pullback (HL) holds above the previous low, and every rally (HH) pushes past the previous high.
The moment that pattern breaks — say, a pullback finally drops below the previous low — it’s often the first warning sign that the trend is losing strength, even before any indicator confirms it. This single read filters out most bad trades before you even look at an entry. Trading with the structure is simply easier than trading against it, because you have the trend itself working in your favor instead of against you.
Support and Resistance: The Levels That Matter
Support is a price floor where buying has stepped in before; resistance is a price ceiling where selling has shown up before. Price doesn’t move in a straight line — it travels from level to level, pausing, testing, and often reacting at the same zones repeatedly.
Two details trip up most beginners here. First, support and resistance work best as zones, not exact lines — price rarely reverses on the same tick twice, so give each level a small buffer rather than expecting pinpoint accuracy. Second, round numbers matter more than most new traders expect. Prices like 100, 1.2000, or 50,000 often act as psychological magnets simply because so many traders and algorithms watch them. Mark the two or three zones where price has clearly reversed in the past, and you’ll find most price action setups form right around them.
Reading Price Action Across Multiple Timeframes
The same chart can look completely different depending on the timeframe you’re viewing. A 15-minute chart might show a sharp downtrend while the daily chart behind it is still climbing steadily. Most experienced price action traders solve this with a simple top-down approach: check a higher timeframe first to establish the overall bias, then drop down to a lower timeframe to time the actual entry.
For example, you might use the daily chart to confirm the broader trend is up, the 4-hour chart to spot the current pullback, and the 1-hour or 15-minute chart to wait for a reversal candle before entering. This way, you’re always trading in the direction of the bigger picture instead of getting shaken out by short-term noise.
Does Price Action Work the Same in Stocks, Forex, and Crypto?
The core principles — structure, levels, and reaction candles — apply everywhere. But the context around them shifts by market. Stocks can gap sharply at the open due to earnings or overnight news, so price action around the opening bell often needs a wider buffer. Forex trades almost continuously from Monday to Friday, and the cleanest structure tends to form during the London and New York session overlap, when liquidity is highest. Crypto trades 24/7 with no closing bell at all, which means trends can run longer but also whip back violently on thin weekend liquidity.
If candlestick basics still feel unfamiliar before you start comparing markets, it’s worth slowing down with our step-by-step guide to reading stock charts for beginners first — the fundamentals carry over directly once you’re comfortable with them.
Four Price Action Patterns Worth Knowing
Pin Bar (Rejection Candle)
A small body with a long wick on one side, showing price was pushed away from a level hard and fast. A long lower wick at support often signals buyers stepping back in; a long upper wick at resistance signals the opposite.
Engulfing Candle
A candle that fully swallows the body of the one before it, in the opposite color. It shows a sharp shift in control from sellers to buyers, or the reverse, usually right at a key level.
Inside Bar
A small candle that fits entirely within the range of the one before it. It marks a pause — coiled energy — and often precedes a breakout in the direction of the move that came before it.
Double Top or Double Bottom
Two attempts to push past the same level, both rejected at roughly the same price. It’s one of the more reliable reversal signals because it shows the market tested a level twice and failed twice — momentum is fading.
Where Volume Fits Into the Picture
Price action is the main read, but volume is the detail that tells you how much conviction is behind a move. A breakout above resistance on a sharp rise in volume is far more trustworthy than the same breakout on quiet, thin trading — the first suggests real buying pressure, the second often fails and snaps back into the old range.
The same logic applies to reversals. A pin bar or engulfing candle that forms on a volume spike — especially after a long trend — can mark genuine exhaustion, where the last sellers (or buyers) are finally giving up. Volume won’t replace a price action read, but it’s a quick, honest gut-check on whether a pattern has real weight behind it.
Combining Price Action With the Bigger Picture
Price action tells you what’s happening on this chart, right now. It doesn’t tell you the broader context — trend across timeframes, momentum, or how an asset behaves relative to the wider market. That’s where it pays to layer in a wider toolkit alongside it. If you haven’t yet, it’s worth reading our complete guide to technical analysis to see how price action fits alongside the other tools traders use to confirm a setup.
Building a Simple Price Action Trading Plan
Reading the chart is only half the job. Without a repeatable process, even a correct read turns into a guess. Here’s a simple framework to build from:
- Set the bias. Check a higher timeframe to confirm whether the overall trend is up, down, or ranging.
- Mark the levels. Plot the two or three support and resistance zones closest to current price.
- Wait for a reaction. Don’t act until price actually reaches one of those zones and shows a pin bar, engulfing candle, or other clear reversal signal.
- Check the volume. Confirm the reaction candle has meaningful participation behind it, not just a quiet drift.
- Size and place the trade. Define your stop-loss, target, and position size before you enter — never after.
Managing Risk Once You Spot a Setup
Spotting a clean pin bar at support feels great — but it’s not a trade until you know your stop-loss, your target, and how much you’re actually risking. Price action gives you the “where,” and proper risk management decides whether that “where” is even worth taking. All trading, including price action trading, carries real risk of loss, and it’s worth reading a sober outside perspective on this before risking real capital — the U.S. SEC’s investor bulletin on day trading is a clear, no-hype starting point.
Once you know your entry and stop, position size is what actually controls how much of your account is on the line. Use a fixed percentage of your account per trade rather than a fixed number of shares or lots, so a string of losses never does outsized damage.
Check the trade before you take it
Plug in your entry, stop, and target for an instant risk-reward read, then size the position correctly for your account.
If you’d rather work from account size and risk percentage directly, the Position Size Calculator does that math for you in seconds.
Common Mistakes Beginners Make
- Trading every pin bar or engulfing candle without checking if it’s at a meaningful level
- Ignoring the higher timeframe trend and fighting it on a lower one
- Treating support and resistance as exact lines instead of zones
- Skipping a stop-loss because “the setup looks too good to fail”
- Adding more indicators to “confirm” a read instead of trusting clean structure
- Sizing every trade the same way regardless of how far the stop-loss sits
Frequently Asked Questions
Do I need indicators at all if I trade price action?
No, but they aren’t forbidden either. Many price action traders keep one or two indicators, like a moving average for trend context, purely as a secondary confirmation — never as the primary signal.
What timeframe is best for price action trading?
There’s no single best timeframe. Swing traders often read daily and 4-hour charts, while day traders work on 15-minute or 1-hour charts. What matters more is checking a higher timeframe for context before acting on a lower one.
Can price action be used for both stocks and crypto?
Yes. The mechanics of reading candles, structure, and levels are the same across stocks, forex, and crypto. What changes is volatility, trading hours, and how much buffer to give your levels.
How long does it take to get good at reading price action?
Most traders need several months of consistent chart review before structure and patterns start to feel intuitive. Reviewing past charts candle-by-candle speeds this up far more than reading alone.
- Price action reads the candles directly — no lag, no clutter.
- Start with structure: higher highs/lows, lower highs/lows, or range.
- Mark support and resistance zones where price has reacted before, and respect round numbers.
- Use a top-down, multi-timeframe approach: bias on the higher chart, trigger on the lower one.
- Watch for pin bars, engulfing candles, inside bars, and double tops/bottoms at those zones.
- Confirm reactions with volume, then size and risk every trade before entering.
Price action rewards patience more than complexity. Once you can glance at a chart and read the trend, the key levels, and a reaction candle in a few seconds, you’ll find you need a lot less on your screen than you thought — and a lot more discipline in how you act on what you see.