What Is Stock Market Analysis?
A Complete Beginner’s Guide
Everything you need to understand how markets are analyzed — from reading your first chart to building a real investment strategy.
What Is Stock Market Analysis?
At its core, stock market analysis is the process of evaluating stocks, sectors, and broader market conditions to make smarter investment decisions. Whether you’re trying to figure out if a company’s share price is fairly valued, spotting a bullish trend before it runs, or simply trying to understand why a stock moved 8% overnight — analysis is the toolkit you reach for.
Think of it like buying a used car. You wouldn’t hand over your money without checking the mileage, looking under the hood, and comparing prices with similar models. Stock analysis works the same way — it gives you a structured way to evaluate what you’re buying before you spend a single dollar.
Stock market analysis doesn’t guarantee profits. No method does. But it dramatically improves the quality of your decision-making — moving you from guessing to reasoning with evidence. That distinction, over time, makes an enormous difference to returns.
Stock market analysis is the systematic evaluation of securities using financial data, price charts, and market psychology to determine their value and predict future price movement.
Why Does Analysis Matter for Investors?
The stock market is not a casino — even though it can feel like one when you’re first starting out. Prices move for reasons, and those reasons can be understood, anticipated, and acted on. That’s the entire premise behind market analysis.
Without analysis, you’re essentially making decisions based on headlines, tips from friends, or gut instinct. Any of these can get lucky in the short term. But over months and years, the investors who consistently outperform tend to be the ones who have developed a systematic approach to evaluating stocks.
Here’s what good analysis helps you do:
According to research into market prediction methodologies, investors who combine at least two analytical frameworks — rather than relying on a single method — tend to build more robust portfolios over time. That’s the real goal: not perfection, but consistency.
The Three Core Types of Analysis
Serious investors don’t pick just one lens. Most experienced traders and long-term investors use a blend of all three major analytical approaches depending on what they’re trying to achieve. Here’s the big picture:
| Type | What It Studies | Best For | Time Horizon |
|---|---|---|---|
| Fundamental Analysis | Company financials, earnings, business model | Long-term investors, value investors | Months to years |
| Technical Analysis | Price charts, patterns, volume, indicators | Traders, swing investors | Days to weeks |
| Sentiment Analysis | News, social media, investor psychology | Short-term traders, macro investors | Hours to days |
None of these approaches is universally “better.” A day trader and a 40-year retirement investor have completely different needs — so naturally, they’ll rely on different tools. The key is matching the right type of analysis to your goals and investment timeline.
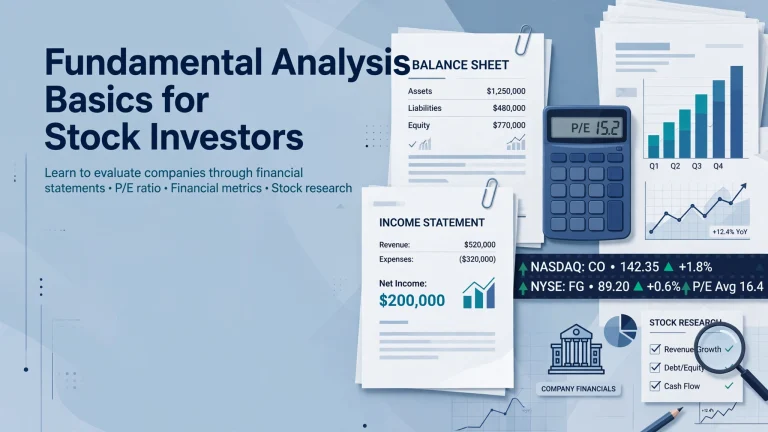
Fundamental Analysis Explained
Fundamental analysis is the art of figuring out what a company is actually worth — independent of what the market is currently pricing it at. The gap between those two numbers is where investors make (or lose) money.
Warren Buffett, arguably history’s most famous investor, built his entire fortune on fundamental analysis. His approach: find high-quality businesses trading below their intrinsic value, buy them, and hold on.
What Fundamental Analysts Look At
There are two layers to fundamental analysis. The first is the company itself — its financials, business model, management, and competitive position. The second is the wider economic environment the company operates in.
Key Financial Metrics to Know
| Metric | What It Tells You | Rule of Thumb |
|---|---|---|
| P/E Ratio | How much investors pay per $1 of earnings | Lower = potentially cheaper vs. peers |
| EPS (Earnings Per Share) | Profit allocated to each share | Growing EPS = healthy business |
| Revenue Growth | Is the business actually expanding? | Consistent growth beats volatile spikes |
| Debt-to-Equity | How leveraged the company is | High D/E = higher risk, especially in rate hikes |
| Free Cash Flow | Cash left after maintaining/expanding operations | Positive FCF = self-sustaining business |
| Return on Equity (ROE) | Efficiency of shareholder capital use | 15%+ consistently = strong management |
You don’t need to be an accountant to use these. Most brokerage platforms display them prominently on stock pages. The skill lies in knowing how to compare them within the same sector — a P/E of 25 might be cheap for a tech company but expensive for a utility.
Investors who want to build wealth steadily over years. If you’re buying stocks to hold for 3–10 years and don’t want to watch price charts daily, this is your primary framework.
Technical Analysis Explained
Technical analysis takes a completely different approach. Instead of asking “Is this a good company?”, it asks “What is the price doing, and where is it likely to go next?”
The underlying belief is that all known information about a stock — earnings, news, investor sentiment — is already reflected in its price. So rather than digging through balance sheets, technical analysts study charts to find patterns that repeat across markets and time.
This is a rich, well-developed field. Platforms like Ucharts’ guide to technical analysis in trading provide a thorough breakdown of how these methods are applied in real market conditions — from identifying trend lines to reading oscillators.
How Price Charts Work
A stock chart is a visual record of price movement over time. Every candlestick, bar, or line represents trading activity during a specific period. Learning to read charts is one of the most practical skills a beginner can develop — and it’s more intuitive than it sounds once you get started.
Core Concepts in Technical Analysis
Markets move in trends — uptrends (higher highs, higher lows), downtrends (lower highs, lower lows), and sideways consolidation. The trend is considered the path of least resistance, so trading with it generally offers better odds than fighting it.
Support is a price level where buying historically overwhelms selling. Resistance is the opposite — where sellers tend to dominate. These levels act like floors and ceilings on price movement and are among the most actionable concepts in all of technical analysis.
Price moves accompanied by high volume are considered more significant and reliable than moves on thin volume. A breakout to new highs on low volume is often viewed skeptically — it might not hold.
Recurring formations like head-and-shoulders, double tops, triangles, and flags signal potential future price movements. These patterns emerge from collective human behavior — fear, greed, and indecision — which tend to repeat across different markets and eras.
Moving averages smooth out price noise to reveal the underlying trend direction. The 50-day and 200-day moving averages are among the most watched by institutional and retail investors alike.
Neither wins outright. Many of the world’s top investors use fundamentals to select what to buy and technical analysis to decide when to buy it. The combination is often more powerful than either alone.
Sentiment Analysis Explained
Markets aren’t just driven by numbers and charts — they’re driven by people. And people are emotional. Sentiment analysis attempts to measure the collective mood of the market: are investors fearful or greedy? Optimistic or panicking? That mood, at extremes, often predicts near-term price movements more accurately than any spreadsheet.
The famous Warren Buffett quote captures this beautifully: “Be fearful when others are greedy, and greedy when others are fearful.” That’s sentiment analysis in a single sentence.
How to Gauge Market Sentiment
There are several practical tools for measuring sentiment. The CBOE Volatility Index (VIX) — often called the “fear gauge” — spikes when investors are anxious and falls when confidence is high. The put/call ratio measures how many investors are betting on declines versus advances. News flow, analyst ratings shifts, and even social media chatter on platforms like Reddit or X (formerly Twitter) all feed into sentiment reads.
Keeping up with real-time market news and price data is a foundational part of any sentiment-aware investment approach. Context around why prices are moving matters just as much as the price movements themselves.
⚡ The Sentiment Extreme Principle
When virtually everyone is bullish and the headlines are euphoric, the market is often close to a top. When fear is universal and every analyst is cutting targets, bottoms tend to form. Sentiment analysis doesn’t tell you exactly when to act — but it tells you what kind of environment you’re operating in.
How to Read a Stock Chart
Reading a stock chart for the first time can feel overwhelming. There are lines everywhere, colored candles, overlapping indicators, and enough jargon to fill a textbook. But the fundamentals are genuinely simple once you break them down.
The in-depth resource at Ucharts: How to Read Stock Charts walks through this in excellent detail. Here’s the essential framework for beginners:
The Anatomy of a Candlestick
The most common chart type is the candlestick chart, developed in 18th century Japan. Each candle represents a single time period (a day, hour, 15 minutes — whatever you set). It shows four things: the opening price, the closing price, the highest price reached, and the lowest price reached during that period.
A green (or white) candle means the price closed higher than it opened — bullish. A red (or black) candle means it closed lower — bearish. The body of the candle is the difference between open and close. The “wicks” or “shadows” extending above and below show the high and low extremes.
Timeframes and What They Tell You
Different timeframes reveal different information. A 5-minute chart is useful for a day trader trying to time an entry within a single session. A weekly chart shows the big-picture trend that position investors care about. Most analysts recommend starting with the daily chart, which offers a solid balance of detail and perspective.
Looking at only one timeframe and treating it as the full picture. Always check a higher timeframe chart (e.g., weekly) before making decisions based on a lower one (e.g., daily). A stock that looks bullish on a daily chart may be in a clear downtrend on the weekly.
Key Technical Indicators for Beginners
Technical indicators are mathematical calculations based on price and/or volume. They help confirm trends, identify momentum, and flag potential reversals. The challenge is that there are hundreds of them — and beginners often make the mistake of piling every indicator onto a single chart until it’s unreadable.
Start with a small toolkit. Master a few indicators deeply rather than knowing a dozen superficially. Here are the five most important for beginners:
| Indicator | What It Does | How to Use It |
|---|---|---|
| Moving Average (MA) | Smooths price to show trend direction | Price above 200 MA = long-term uptrend. MA crossovers signal momentum shifts. |
| RSI (Relative Strength Index) | Measures speed and magnitude of price changes | Above 70 = potentially overbought. Below 30 = potentially oversold. |
| MACD | Shows relationship between two moving averages | When MACD crosses above signal line = bullish. Below = bearish. |
| Bollinger Bands | Measures volatility around a moving average | Price touching upper band = stretched. Squeeze = breakout often incoming. |
| Volume | Shows how many shares traded in a period | High volume on breakouts confirms the move. Low volume = treat with skepticism. |
The full Ucharts breakdown of stock market analysis tools and methodologies goes deeper into each of these indicators, with practical examples and chart walkthroughs.
Tools and Platforms to Use
Theory only takes you so far. You need to actually put analysis into practice — and that means having the right tools. Fortunately, beginner investors today have access to professional-grade tools that were once reserved for institutional traders.
What to Look for in an Analysis Platform
The best platforms for stock analysis offer real-time price data, customizable charts with indicator overlays, fundamental data screens, news integration, and ideally a paper trading (simulated) mode where you can practice without risking real money.
The introduction to Ucharts explains exactly how the platform is structured and what each feature set is designed to do — well worth reading before you dive into the charting tools. There’s also a detailed look at the specific benefits of using Ucharts for both beginners and more experienced traders looking for an edge.
Automated Trading Tools
Once you’re comfortable with manual analysis, you may want to explore automation. Automated trading robots can execute strategies based on predefined conditions — removing emotion from trades and enabling round-the-clock activity. These aren’t for absolute beginners, but understanding they exist helps you plan your learning path.
Common Beginner Mistakes to Avoid
Every experienced investor has a collection of painful early mistakes. The good news is that most beginner errors follow predictable patterns — which means they’re learnable, and avoidable if you know what to watch for.
Not every price move carries meaning. Markets fluctuate daily for countless reasons. Learning to distinguish meaningful signals from random noise is one of the most important skills in analysis — and it takes time to develop.
Analysis tells you what to buy and when. Risk management tells you how much to buy and when to get out if you’re wrong. Beginners often focus entirely on finding great trades and neglect planning what they’ll do if the trade goes against them. Know your stop-loss before you enter any position.
A chart with 10 overlapping indicators doesn’t give you 10x the information — it just creates confusion and analysis paralysis. Most professional traders use 2–3 indicators maximum, selected carefully to complement rather than duplicate each other.
Fear and greed are the two biggest destroyers of investment returns. Analysis gives you a structured framework that removes — or at least constrains — emotional decision-making. Stick to your system even when it’s uncomfortable.
Buying something because it’s already gone up a lot is one of the most common and costly beginner mistakes. A stock that has doubled may be fairly valued, or even overvalued. Price history tells you what happened — analysis helps you figure out what might happen next.
If you’re eventually considering a funded trading account, do your research carefully. Resources like how traders should pick a prop firm help you evaluate the key questions around payouts, rules, and sustainability before committing capital.
Smaller stocks can offer explosive returns — but they also come with dramatically higher risk and thinner liquidity. If you explore micro-cap stocks, make sure your analytical rigor doubles, not halves. Scams and pump-and-dump schemes disproportionately target this segment of the market.
How to Get Started with Stock Analysis Today
The best analysis system is the one you’ll actually use consistently. Here’s a realistic, step-by-step path for someone starting from zero:
Before diving into indicators, understand what a stock actually represents, how exchanges function, and the difference between market orders and limit orders. This context makes everything else make more sense.
Spend a week just looking at price charts without doing anything else. Learn to identify trends, spot obvious support and resistance levels, and recognize a few basic candlestick patterns. The Ucharts chart reading guide is an ideal starting point.
Don’t try to watch everything at once. Pick companies you’re familiar with — maybe brands you use daily — and follow their charts and news closely. Familiarity breeds pattern recognition faster than breadth.
Create an account on a platform like Ucharts and start building your first charts with a simple moving average and RSI overlay. Experiment with timeframes. Look at historical data to see how patterns played out.
Run simulated trades using your analysis for at least 30–60 days before putting real capital at risk. Track what would have happened if you’d actually executed those trades. Review your results honestly — both the wins and the losses.
Once you’re consistently applying a basic analytical framework, add one new concept at a time. Maybe that’s fundamental screens, or a new indicator, or following sector rotation. Sustainable learning beats cramming everything at once.
Final Thoughts: Analysis Is a Skill, Not a Secret
Stock market analysis isn’t a magic formula reserved for finance professionals on Wall Street. It’s a learnable set of skills — frameworks for thinking clearly about complex, uncertain situations — that anyone with patience and genuine curiosity can develop.
The journey typically goes something like this: confusion, then gradual clarity, then a period of false confidence (where you think you know more than you do), followed eventually by genuine competence. Most people who succeed in markets have passed through all four stages. The analysis tools are what compress that journey.
Start simple. Be consistent. Review your decisions — not just the outcomes, but the reasoning that led to them. And use the resources available to you. Platforms like Ucharts exist precisely to give retail investors access to the same caliber of tools and data that professional traders use every day.
The market rewards preparation. That preparation begins right here.
Ready to Start Analyzing Markets?
Join thousands of traders using Ucharts to access professional-grade charting, real-time data, and beginner-friendly analysis tools.
Create Your Free Ucharts Account →