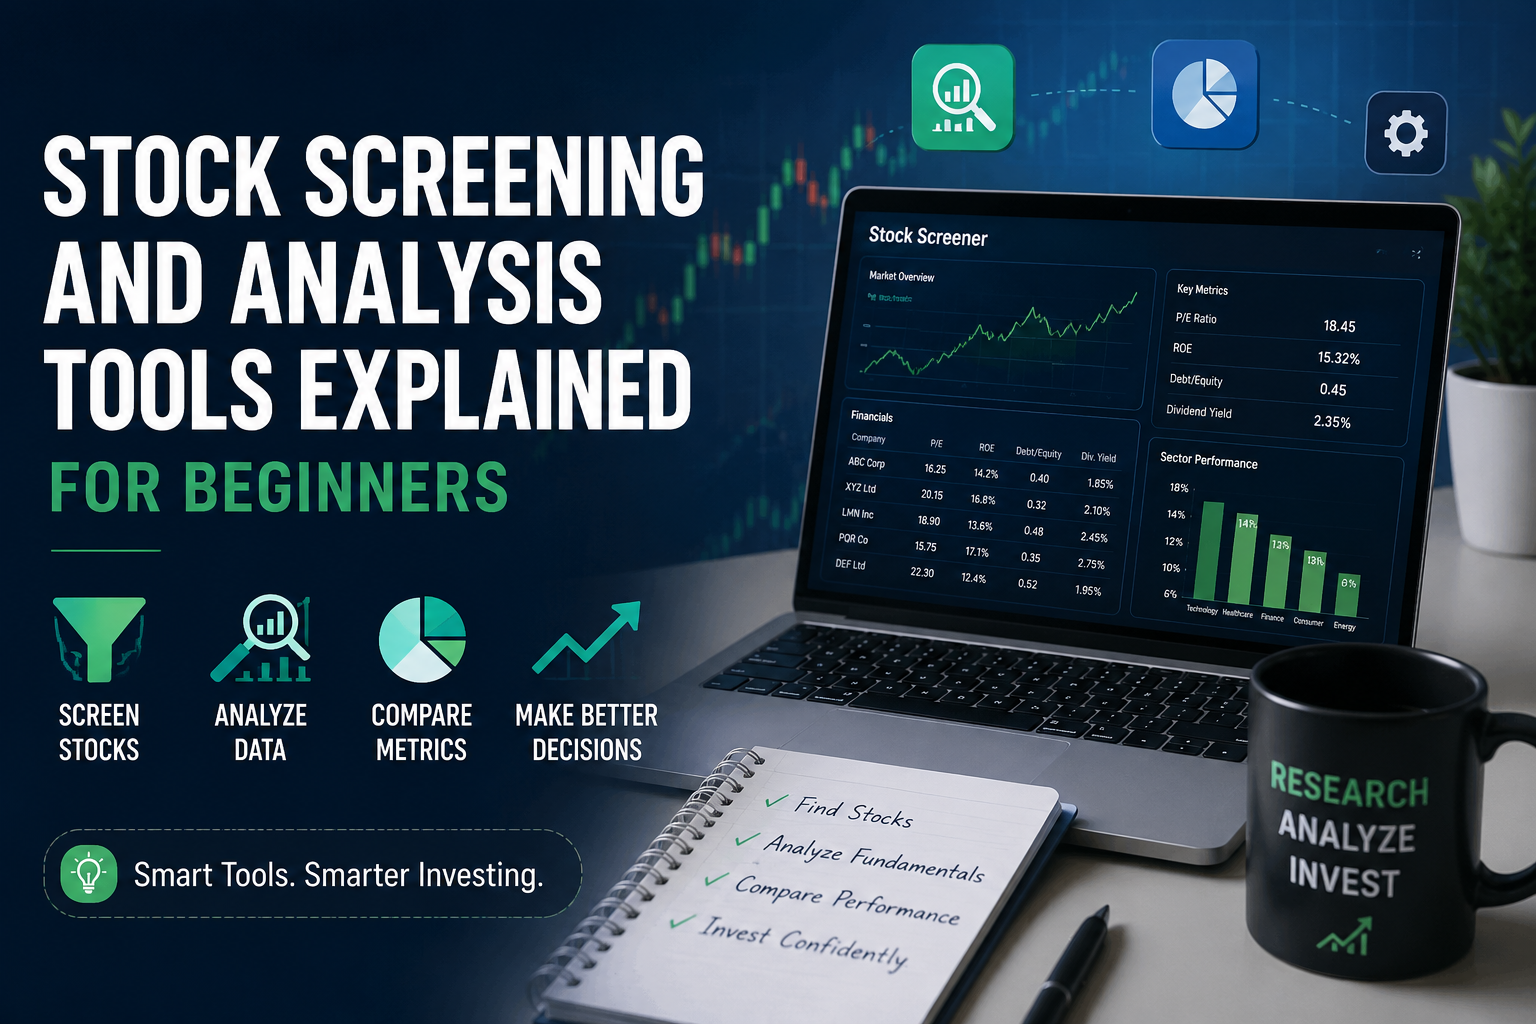
Stock Screening and Analysis Tools Explained for Beginners
How stock screeners work, which filters actually matter, and how to pair them with chart analysis to shortlist stocks worth researching further.
There are thousands of publicly traded stocks, and no investor can manually review all of them. Stock screening tools solve this problem by letting you filter the entire market down to a small, manageable list based on criteria you set — price, sector, valuation, growth, or technical setup. This guide explains how screening tools work, which filters matter most for beginners, and how to move from a screener result to a properly researched decision using chart-based analysis.
For a new investor, the sheer number of choices can be paralyzing. Should you look at large-cap tech companies, dividend-paying utilities, or small-cap growth names? A screener doesn’t answer that question for you, but it does let you turn a vague idea — “I want a profitable company trading below its historical average valuation” — into a concrete, testable list of names within seconds.
What Is a Stock Screener?
A stock screener is a filtering tool that searches the entire market — often thousands of listed companies — and returns only the stocks that match criteria you specify. Instead of scrolling through an index one company at a time, you set conditions like “market cap above $1 billion” or “P/E ratio below 20,” and the screener instantly returns every stock that fits.
Most screeners are built around a database of company financials and price data that updates on a regular schedule. You combine filters using simple logic — for example, requiring a stock to satisfy several conditions simultaneously — and the tool cross-references every listed company against those rules in the background, so the results appear almost instantly even though thousands of companies were checked.
Some screeners also allow you to save a set of filters as a reusable template, which is worth doing once you settle on a strategy you’re comfortable with. Rerunning a saved screen weekly or monthly is a simple habit that keeps your watchlist fresh without having to rebuild your filters from scratch each time.
Why Screeners Exist
Manually comparing stocks one at a time doesn’t scale. A screener compresses hours of manual comparison into seconds, which is particularly useful when you’re trying to build a watchlist from scratch or looking for stocks that fit a specific strategy, such as dividend growth or momentum breakouts.
Types of Screening Criteria
Most screeners organize filters into a few broad categories. Understanding these categories helps you build a screen that actually reflects the kind of stock you’re looking for, rather than randomly combining filters.
Fundamental Filters
These relate to the underlying business and financial health of the company — market capitalization, revenue growth, profit margins, debt levels, and valuation ratios like price-to-earnings or price-to-book. Fundamental filters are most useful for longer-term investors trying to find financially sound companies trading at reasonable prices.
Technical Filters
Technical filters focus on price behavior rather than the underlying business — moving average crossovers, relative strength, volume spikes, or proximity to a 52-week high or low. These are typically used by shorter-term traders looking for specific chart setups rather than long-term value.
Sector and Category Filters
These narrow results by industry, geography, exchange, or asset class. They’re useful when you already have a thesis — for example, wanting exposure to a specific sector — and simply need to compare the companies within it.
| Filter Type | Example Criteria | Best Suited For |
|---|---|---|
| Fundamental | P/E ratio, revenue growth, debt-to-equity | Long-term investors |
| Technical | Moving average crossover, RSI, volume spike | Short-term traders |
| Sector/Category | Industry, exchange, market cap tier | Thesis-driven research |
Building Your First Screen
Beginners often make the mistake of adding too many filters at once, which can shrink results down to almost nothing or exclude perfectly reasonable companies. A simpler, staged approach tends to work better.
Think of each filter as a trade-off rather than a free improvement. Every additional condition you add narrows the pool further, which is useful up to a point, but past that point you risk cutting out solid companies simply because they miss one arbitrary number on a metric that may not even be that important to your actual goal.
- Start broad. Set one or two basic filters, such as market cap and sector, to establish a general universe of stocks.
- Add a valuation filter. Introduce a single valuation metric, like P/E ratio, to avoid overpaying relative to earnings.
- Add a quality filter. Include something like debt-to-equity or profit margin to filter out financially weak companies.
- Review the shortlist manually. Once the list is down to a manageable number — usually under 30 — start reviewing companies individually rather than adding more filters.
Moving from Screener Results to Chart Analysis
Once a screener narrows the market down to a shortlist, the next step is reviewing each candidate’s price chart. This is where fundamental filtering and technical analysis meet — a stock can pass every fundamental filter and still be in a poor position to buy based on where it currently sits on the chart.
This is one of the most common gaps in a beginner’s process: finding a fundamentally sound company through a screener, then buying immediately without checking whether the current price represents a reasonable entry point on the chart. A great business bought at a poor technical level can still result in an uncomfortable, prolonged drawdown before it works out.
Look for Chart Structure, Not Just Price
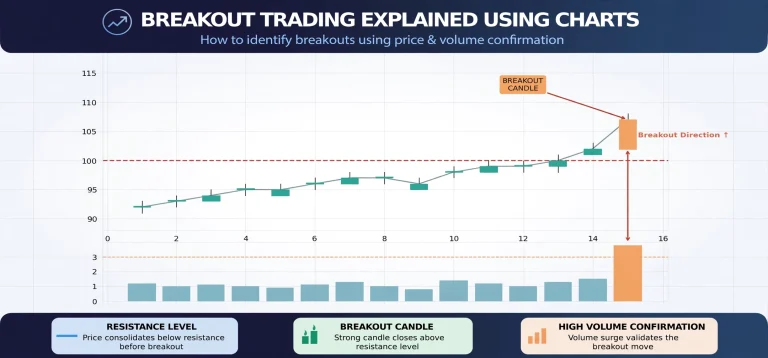
Rather than reacting to the current price alone, look at the broader trend and where the stock sits relative to recent highs and lows. Our guide on breakout trading explained using charts covers how to distinguish a genuine breakout from a false one — a distinction that matters a great deal once you’ve shortlisted a stock and are deciding whether current price action supports an entry.
Confirm with Candlestick Patterns
Individual candlestick formations can offer additional confirmation around key levels. Reviewing common patterns — such as reversal or continuation candles near support and resistance zones — adds another layer of context beyond the raw screener output. A good reference for this is our guide to candlestick patterns every trader must know, which breaks down the most common formations in plain language.
Analysis Tools Beyond the Screener
Screening narrows the field, but a complete analysis process usually draws on a few additional tools once a shortlist is in place.
None of these tools need to be expensive or complex. Many beginners assume proper analysis requires a paid terminal subscription, but a combination of a free screener, a solid charting tool, and a couple of risk calculators covers the vast majority of what a retail investor actually needs before making a decision.
- Charting platforms — for reviewing price trend, volume, and technical indicators on individual stocks.
- Financial statement viewers — for checking income statements, balance sheets, and cash flow directly from company filings.
- Risk calculators — for sizing a position appropriately once you’ve decided a stock is worth trading.
- News aggregators — for catching recent developments a screener’s static filters wouldn’t capture.
Common Beginner Mistakes with Screening Tools
Screeners are powerful, but a few habits consistently trip up beginners. Recognizing these early can save a lot of wasted time chasing results that look promising on paper but fall apart under closer review.
Over-Filtering
Stacking too many conditions at once can eliminate solid companies simply because they miss one arbitrary threshold. It’s usually better to start with two or three filters and refine gradually.
Ignoring Context
A stock can meet every numeric filter and still be a poor candidate due to pending litigation, a recent earnings miss, or sector-wide headwinds that don’t show up as a screener column. Always read recent news on shortlisted names before moving further.
Treating Screener Data as Real-Time Truth
Some free screeners update fundamental data with a delay, particularly around earnings season. Always cross-check key figures like recent earnings or debt levels against the company’s official filings before relying on them for a decision.
Putting It All Together
A practical beginner workflow looks like this: use a screener to narrow thousands of stocks down to a shortlist based on two or three meaningful filters, review each shortlisted company’s chart for trend and structure, confirm with candlestick signals near key levels, and finally check recent news and official filings before committing capital. Skipping any one of these steps leaves a gap — a screener alone doesn’t account for chart timing, and a chart alone doesn’t account for the underlying business quality.
As you get more comfortable, you’ll likely develop a personal set of go-to filters that reflect your own strategy, whether that’s value investing, growth investing, or short-term technical trading. The screening process stays the same; only the specific filters change based on what you’re looking for.
It’s also worth revisiting your screening criteria periodically rather than treating them as fixed. Market conditions shift — valuation ranges that looked cheap during a downturn can look expensive again once sentiment recovers. Reviewing your filters every few months keeps your screens aligned with the current market environment, rather than anchored to assumptions from months earlier.
Final Takeaway
Stock screeners are one of the most efficient ways to turn an overwhelming market into a manageable shortlist, but they work best as the first step in a broader process — not the last. Pair your screener results with chart analysis and fundamental verification before making any decision.
The goal isn’t to find a perfect filter combination that guarantees good picks — no such combination exists. The goal is a repeatable process that consistently narrows your focus to reasonable candidates, so the time you spend on deeper research is spent where it actually matters.
To build on this workflow, review our guide on breakout trading explained using charts, and once you’re ready to size a trade, use our Pips Calculator for accurate position planning.