Candlestick Patterns Every Trader Must Know
A colorful, easy-to-follow breakdown of the bullish, bearish, and continuation candlestick patterns that show up on charts every single day.
Candlestick patterns are the closest thing traders have to a shared visual language. A single shape — or a small combination of two or three candles — can reveal whether buyers or sellers are gaining the upper hand, often before the news catches up. Whether you trade stocks, forex, or crypto, learning to recognize these patterns quickly is one of the highest-value skills you can build as a trader.
This guide walks through the most important candlestick patterns, organized by type, along with practical notes on how reliable each one tends to be and how to avoid the common trap of trading a pattern in isolation.
Why Candlestick Patterns Matter
Every candlestick pattern is really a snapshot of crowd psychology. When thousands of traders are buying and selling the same asset at the same time, their combined decisions leave a visible fingerprint on the chart. A long lower wick shows rejection of lower prices. A tight cluster of small bodies shows hesitation. A string of large green candles shows conviction. Once you learn to read these fingerprints, price charts stop looking like random noise and start telling a coherent story.
That said, no pattern works 100% of the time. The goal isn’t to find a “guaranteed” signal — it’s to stack the odds in your favor by combining pattern recognition with trend context, support and resistance, and proper risk management.
Single-Candle Patterns You Should Know
These patterns form from just one candle but can still carry significant meaning, especially when they appear at key support or resistance levels.
Hammer
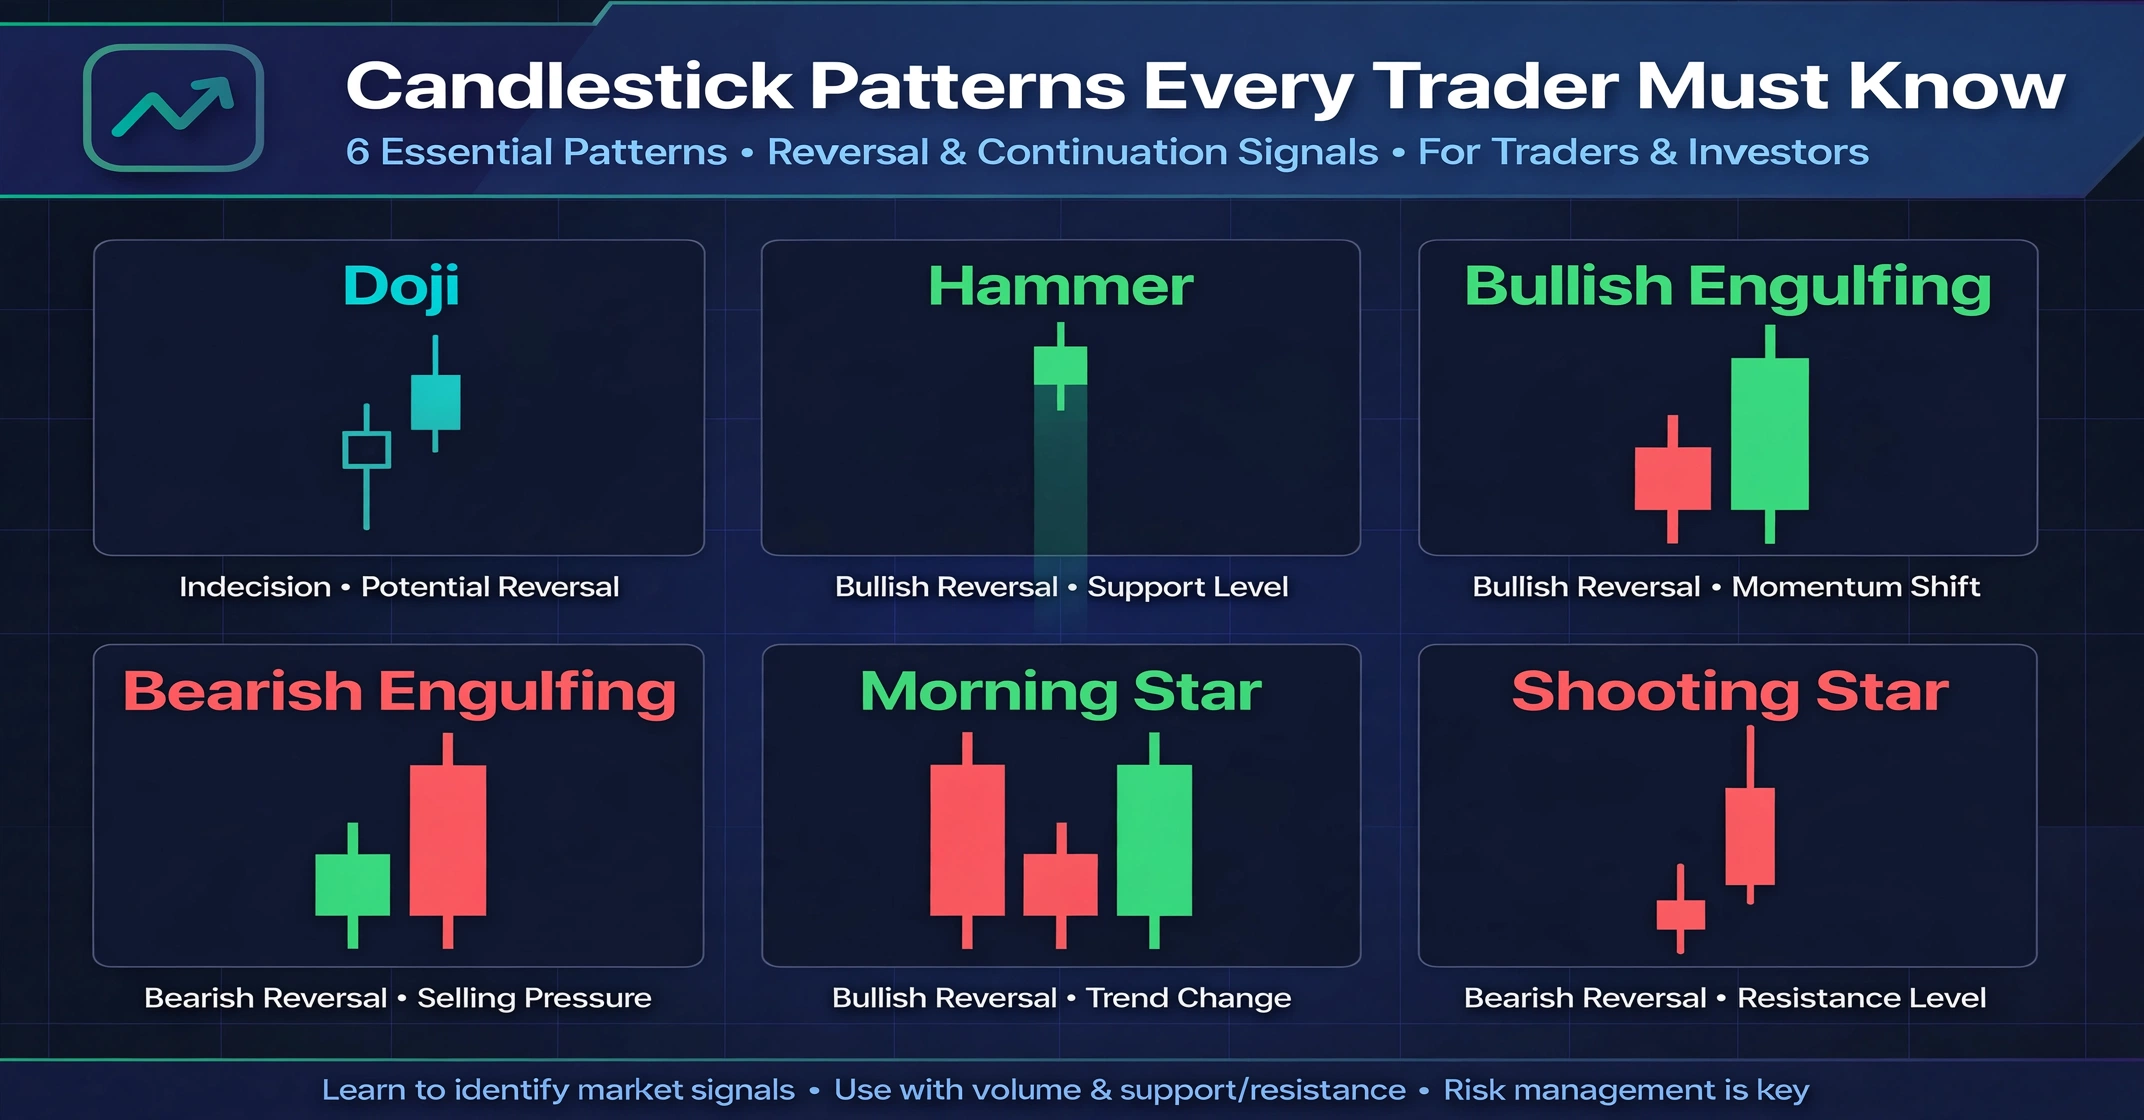
A Hammer has a small body near the top of the candle and a long lower wick at least twice the size of the body. It typically appears after a downtrend and shows that sellers pushed price lower, but buyers stepped in aggressively and forced a strong recovery before the close.
Shooting Star
The mirror image of the Hammer — a small body near the bottom with a long upper wick. It usually appears after an uptrend and suggests buyers tried to push higher but were firmly rejected, opening the door for a possible reversal.
Hanging Man
This pattern looks identical to a Hammer but appears at the top of an uptrend instead of the bottom of a downtrend. The long lower wick shows that sellers were able to push price down significantly during the session, which is often an early warning sign for buyers.
Doji
A Doji forms when the open and close are nearly identical, leaving little to no body. It signals a tug-of-war where neither side won. A Doji appearing right after a strong trend often hints that momentum is starting to fade.
Marubozu
A Marubozu has almost no wicks — just a full-bodied candle from open to close. A bullish Marubozu shows buyers were in complete control from start to finish, while a bearish Marubozu shows the opposite: sellers dominated the entire session.
Two-Candle Reversal Patterns
Two-candle patterns tend to be more reliable than single candles because they capture a genuine shift in sentiment from one period to the next.
Bullish Engulfing
A small bearish candle is followed by a larger bullish candle that completely covers, or “engulfs,” the previous candle’s body. This pattern suggests buyers have decisively overwhelmed the sellers from the prior session.
Bearish Engulfing
The opposite of the bullish version — a small bullish candle is swallowed by a larger bearish candle, signaling that sellers have taken firm control after a period of buying.
Piercing Line
This pattern forms when a bearish candle is followed by a bullish candle that opens below the previous low but closes above the midpoint of the prior candle’s body. It’s a softer version of the bullish engulfing pattern and still signals a potential reversal.
Dark Cloud Cover
The bearish counterpart to the Piercing Line. A bullish candle is followed by a bearish candle that opens above the previous high but closes below the midpoint of the prior body, suggesting selling pressure is building.
Tweezer Top and Tweezer Bottom
Tweezer patterns form when two consecutive candles share almost the exact same high (Tweezer Top) or low (Tweezer Bottom). This shows that price was rejected twice at the same level, which can act as a short-term support or resistance zone.
Three-Candle Patterns
Three-candle formations often carry the highest reliability among classic candlestick patterns, since they show a complete shift in momentum across three consecutive sessions.
Morning Star
This pattern appears at the bottom of a downtrend: a large bearish candle, followed by a small-bodied candle showing indecision, followed by a large bullish candle that closes well into the first candle’s body. It’s considered one of the more dependable reversal signals.
Evening Star
The bearish mirror of the Morning Star, appearing at the top of an uptrend. A large bullish candle is followed by a small indecisive candle, then a large bearish candle, signaling that the uptrend may be running out of steam.
Three White Soldiers
Three consecutive long-bodied bullish candles, each opening within the previous candle’s body and closing near its own high. This pattern shows sustained, strong buying pressure over multiple sessions.
Three Black Crows
The bearish opposite of Three White Soldiers — three consecutive long bearish candles showing sustained selling pressure and a high probability that the downtrend will continue.
Continuation Patterns
Not every pattern signals a reversal. Some candlestick formations simply confirm that the existing trend is likely to continue after a brief pause.
Rising Three Methods
A large bullish candle is followed by three small bearish or sideways candles that stay within the range of the first candle, then a final large bullish candle that pushes to a new high. This shows the uptrend simply paused to consolidate before continuing.
Falling Three Methods
The bearish version — a large bearish candle, three small consolidating candles, then another large bearish candle confirming the downtrend is resuming.
Pattern Reliability at a Glance
| Pattern | Signal Type | Best Used When |
|---|---|---|
| Bullish / Bearish Engulfing | Reversal | At the end of a clear trend, with rising volume |
| Morning / Evening Star | Reversal | At major support or resistance zones |
| Three White Soldiers / Black Crows | Continuation of momentum | Early in a fresh trend, confirming strength |
| Rising / Falling Three Methods | Trend continuation | During a pause inside an established trend |
| Doji | Indecision / possible reversal | After an extended trend showing signs of fatigue |
How to Confirm a Candlestick Pattern Before Trading It
Spotting a pattern is only step one. Before acting on it, experienced traders usually look for confirmation from at least one additional source. This might include a support or resistance level lining up with the pattern, a spike in trading volume, or agreement from a momentum indicator like the RSI or MACD. Trading a pattern purely because it “looks right,” without any supporting evidence, is one of the most common ways beginners lose money.
If you want a broader framework for combining chart patterns with indicators, our guide on using charting tools for better trading decisions covers how to layer multiple tools together instead of relying on any single signal. It’s also worth understanding how overall market mood affects the reliability of these patterns, which we break down in Market Sentiment Analysis: How It Works in Trading.
Best Timeframes for Pattern Trading
Candlestick patterns can appear on any timeframe, from 1-minute charts all the way up to monthly charts, but their reliability generally increases as the timeframe gets longer. A Bullish Engulfing pattern on a daily chart carries far more weight than the same pattern on a 1-minute chart, simply because it reflects the sentiment of a much larger group of participants over a longer period.
Many traders use a “top-down” approach: identify the overall trend on a higher timeframe like the daily or weekly chart, then drop down to a shorter timeframe such as the 1-hour or 4-hour chart to time entries using the patterns discussed above.
Common Mistakes When Trading Candlestick Patterns
- Ignoring the overall trend: A bullish pattern inside a strong downtrend is far less reliable than the same pattern forming at a genuine support zone.
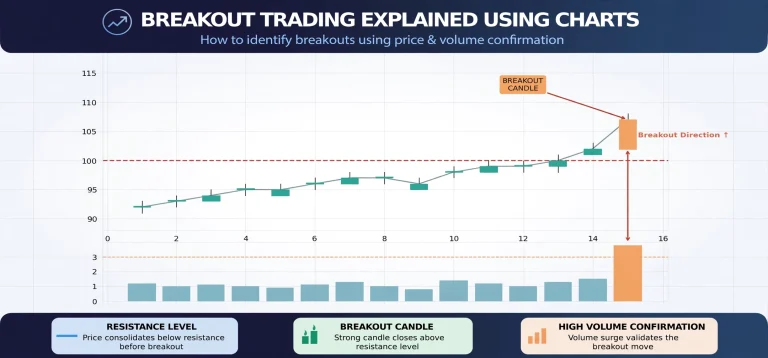
- Skipping volume confirmation: Patterns backed by above-average volume tend to be more trustworthy than those formed during quiet, low-liquidity sessions.
- Trading every single pattern: Not every Doji or Hammer leads anywhere. Selectivity and patience usually outperform reacting to every candle.
- Forgetting risk management: Even a textbook pattern can fail. Stop-loss placement and position sizing matter just as much as the pattern itself.
- Analyzing patterns in isolation: A pattern combined with support/resistance, trendlines, and an indicator is always more powerful than the pattern alone.
For additional research-backed explanations of these formations, resources like Investopedia’s breakdown of powerful candlestick patterns and the technical analysis materials published by the Corporate Finance Institute are useful for reinforcing these concepts with additional real-world examples.
Frequently Asked Questions
Which candlestick pattern is the most reliable?
No single pattern is reliable 100% of the time, but three-candle formations like the Morning Star, Evening Star, Three White Soldiers, and Three Black Crows are generally considered more dependable than single-candle patterns, since they reflect a fuller shift in sentiment.
Should beginners try to learn every candlestick pattern?
Not necessarily. Most traders build a strong foundation with a core set of eight to ten patterns — the ones covered in this guide — and focus on mastering confirmation techniques rather than memorizing every rare variation that exists.
Do candlestick patterns work the same way in every market?
The underlying psychology is universal, but volatile markets like cryptocurrency can produce more false signals than slower-moving markets like blue-chip stocks. Extra confirmation becomes even more important in highly volatile assets.
Practicing Pattern Recognition
Like any skill, candlestick pattern recognition improves with repetition. A simple way to practice is to scroll back through historical charts, cover up the right-hand side of the screen, and try to predict what happens next based purely on the pattern in front of you. Then reveal the outcome and compare. Over time, this exercise trains your eye to spot these formations almost instantly in live markets.
It also helps to practice on a clean, real-time charting interface so that the patterns you study match what you’ll actually see when trading live. Our guide to the UCharts trading charting tool explains how to set up your workspace and start applying these patterns on real market data.
Final Thoughts
Candlestick patterns give traders a fast, visual way to read shifting sentiment in the market. From simple single-candle signals like the Hammer and Doji to more powerful three-candle formations like the Morning Star and Three White Soldiers, each pattern tells part of a larger story about who’s in control — buyers or sellers.
The real edge comes from combining these patterns with trend context, volume, and proper risk management, rather than trading any single signal in isolation. Start with a handful of core patterns, practice spotting them on historical charts, and gradually build the pattern-recognition instincts that experienced traders rely on every day.