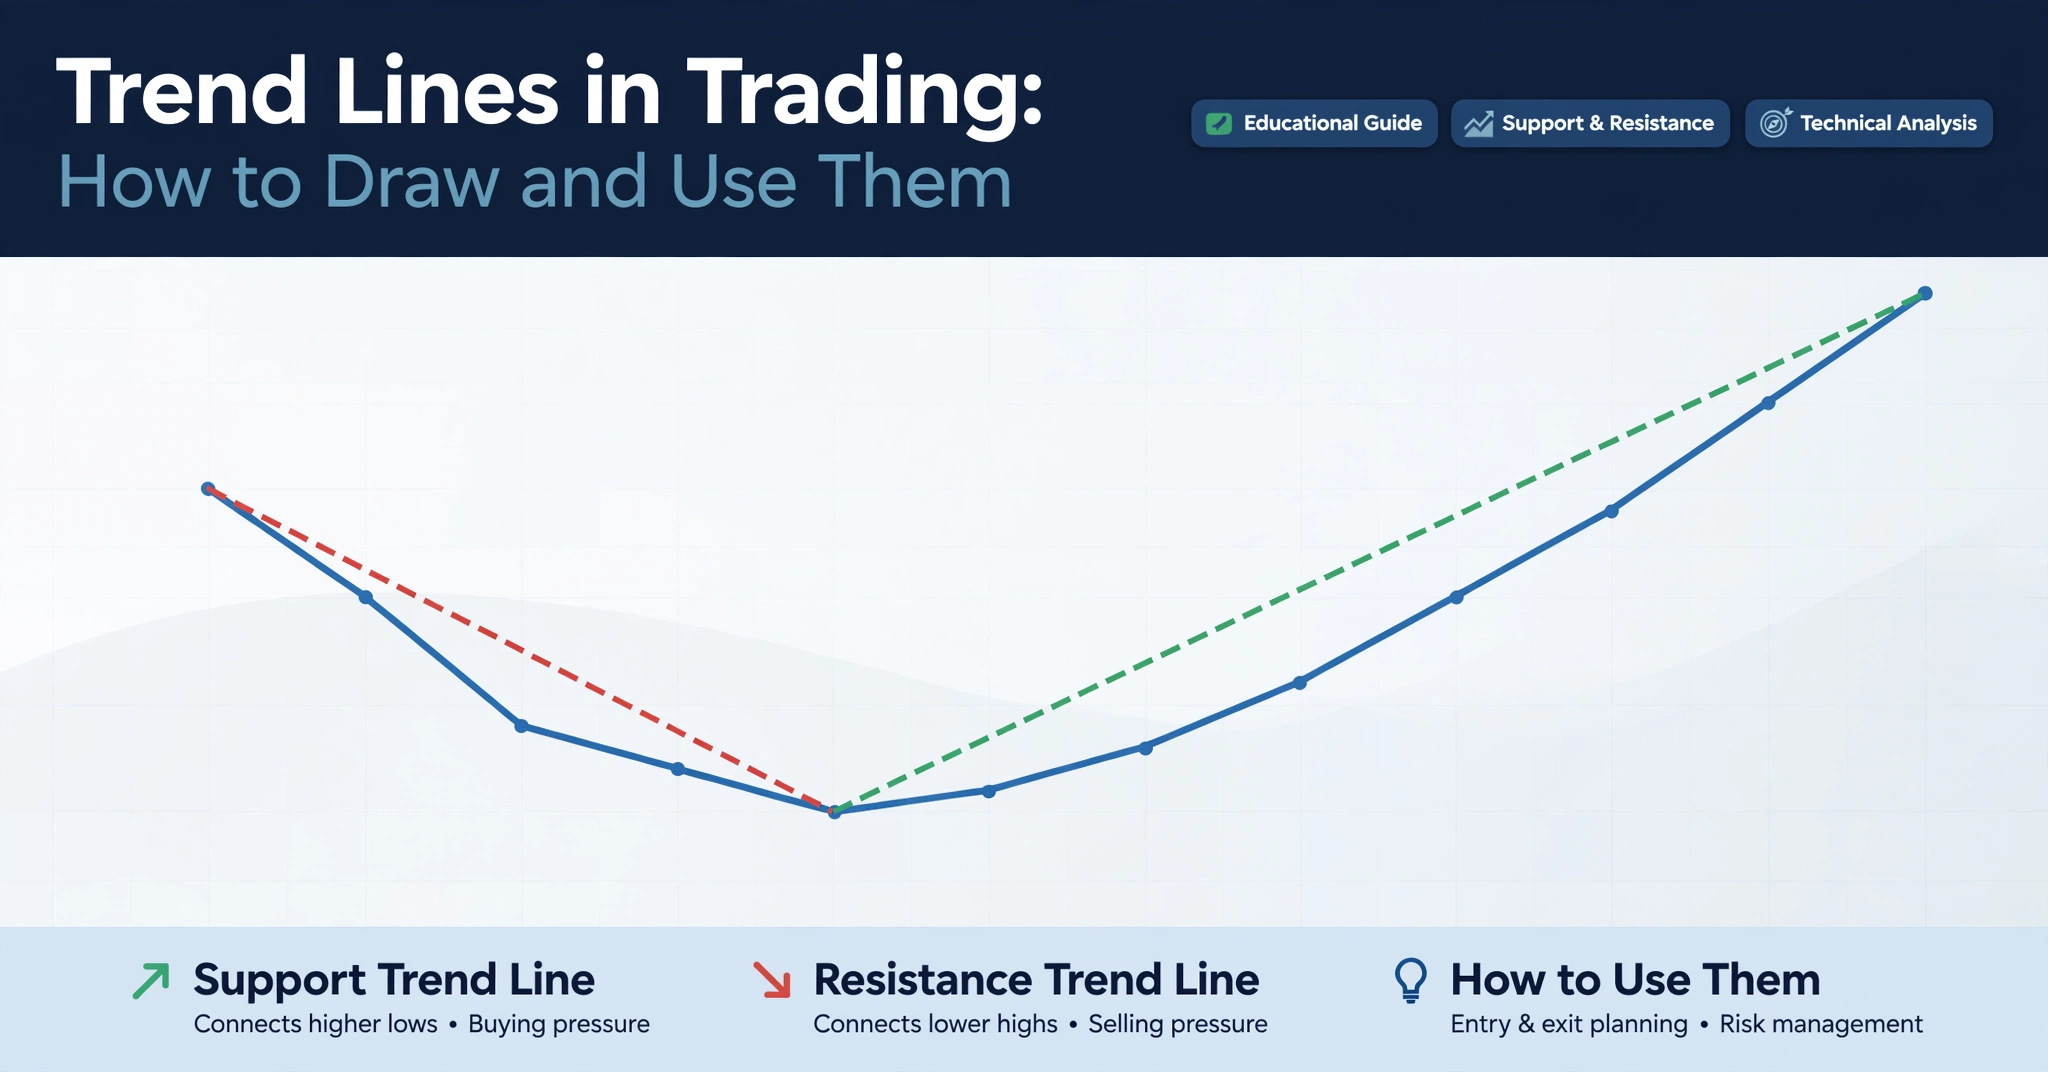
Trend Lines in Trading: How to Draw and Use Them
A step-by-step guide to drawing accurate trend lines and using them to read direction, momentum, and potential reversals.
Long before indicators, algorithms, or automated scanners existed, traders were already tracking markets with a ruler and a pencil, connecting the dots between swing highs and swing lows. That simple technique — the trend line — remains one of the most widely used tools in technical analysis today. It’s easy to learn, works on any chart, and instantly shows you the direction a market has been moving. This guide covers exactly what trend lines are, the different types you’ll come across, and a clear step-by-step process for drawing them correctly.
What Is a Trend Line?
A trend line is a straight line drawn across a chart connecting a series of price points, typically swing highs or swing lows, to visualize the general direction of the market. In an uptrend, a trend line connects a series of rising lows. In a downtrend, it connects a series of falling highs. The resulting line acts as a rough guide for where price has been finding support or resistance as it moves.
Unlike horizontal support and resistance, which stays fixed at one price, a trend line angles upward or downward, shifting in value as time passes. This makes it especially useful for tracking markets that are clearly trending rather than moving sideways.
Why Trend Lines Matter
Trend lines give traders a simple, visual framework for making decisions without relying on complex indicators. They’re used to:
- Confirm the overall direction of a market at a glance.
- Identify potential entry points where price pulls back to the trend line and bounces.
- Spot early warning signs when price starts to break away from an established trend.
- Frame a market’s structure alongside other tools like moving averages or candlestick patterns.
Because they’re drawn directly from price action, trend lines tend to reflect exactly how a specific market has been behaving, rather than relying on a generic formula applied the same way to every asset.
Types of Trend Lines
Uptrend Line
Drawn beneath price by connecting a series of higher lows, an uptrend line acts as dynamic support. As long as price continues to respect this line on pullbacks, the uptrend is generally considered intact.
Downtrend Line
Drawn above price by connecting a series of lower highs, a downtrend line acts as dynamic resistance. Rallies that repeatedly stall at this line suggest sellers remain in control of the broader trend.
Horizontal Trend Line
When price moves sideways without a clear upward or downward slope, a horizontal trend line can be used similarly to a support or resistance level, marking the upper and lower boundaries of the current range.
Internal Trend Line
Sometimes price doesn’t perfectly respect the outermost highs or lows. An internal trend line is drawn through the majority of price action, ignoring a few extreme wicks, and can give a more realistic sense of the trend’s true angle.
How to Draw a Trend Line Correctly Step by Step
- Identify the trend direction first. Look at the broader chart and determine whether price is generally making higher highs and higher lows, or lower highs and lower lows.
- Find at least two swing points. For an uptrend, locate two clear swing lows. For a downtrend, locate two clear swing highs.
- Connect the points with a straight line. Draw the line through those two points and extend it forward across the chart.
- Look for a third touch to confirm validity. A trend line that has only been touched twice is still a guess. A third touch that respects the line adds real confirmation.
- Adjust as new price action forms. Trend lines are not permanent. As new swing points form, you may need to redraw the line slightly to reflect the market’s current structure.
The Angle of a Trend Line: What Steep vs Shallow Means
The steepness of a trend line carries useful information about the strength and sustainability of a trend.
| Trend Line Angle | What It Usually Suggests |
|---|---|
| Very steep | Strong short-term momentum, but often unsustainable long-term without a pullback or consolidation phase. |
| Moderate, steady slope | A healthy, sustainable trend that’s more likely to continue for an extended period. |
| Very shallow / nearly flat | Weak momentum, often signaling a market that’s close to transitioning into a sideways range. |
Extremely steep trend lines are also more prone to being broken quickly, since the angle simply isn’t sustainable for long. When a trend line’s angle keeps getting steeper over time, some traders view it as an early warning sign that the move may be overextended.
Trend Line Break: What Happens When Price Crosses It
A trend line break occurs when price closes clearly on the opposite side of the line, rather than briefly wicking through it. This doesn’t automatically mean the entire trend has reversed — sometimes it simply signals a slowdown or a shift into a sideways consolidation phase. However, a confirmed break, especially one accompanied by increased volume, is often an early signal that the underlying trend is weakening.
Just like with horizontal support and resistance, trend lines can also experience role reversal. A broken uptrend line, once acting as support, can flip and start acting as resistance on the next rally attempt, and vice versa for a broken downtrend line.
Using Trend Lines with Trend Channels
A trend channel is created by drawing a second, parallel line on the opposite side of price from the original trend line. In an uptrend, this second line runs along the swing highs, creating a channel that contains most of the price action. Trend channels are useful because they give traders both a potential entry zone near the lower trend line and a potential target zone near the upper channel line, all from two simple straight lines.
Combining Trend Lines With Other Chart Tools
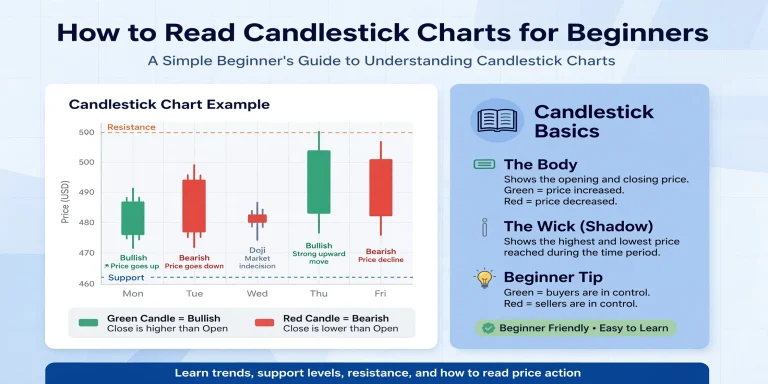
Trend lines rarely work best in isolation. They become far more powerful when combined with other forms of analysis, such as candlestick patterns forming right at the trend line, or momentum indicators confirming the strength of a bounce. Our guide on using charting tools for better trading decisions walks through how to layer multiple tools together rather than relying on a trend line by itself.
If you’re still getting comfortable with the broader charting environment before diving into trend line drawing, our complete guide to the UCharts trading charting tool explains how to set up your workspace, add drawing tools, and start practicing on live price data.
Best Timeframes for Trend Line Analysis
Trend lines can be drawn on virtually any timeframe, but as with most technical tools, higher timeframes tend to produce more reliable, longer-lasting lines. A trend line drawn on a weekly chart, built from months of price action, generally carries far more significance than a similar-looking line on a 15-minute chart, which may only reflect a few hours of trading.
A practical approach many traders use is to identify the dominant trend line on a daily or weekly chart first, then use a shorter timeframe to fine-tune entries whenever price pulls back toward that higher-timeframe line.
Common Mistakes Traders Make When Drawing Trend Lines
- Forcing the line to fit a bias: Drawing a line that only technically connects by ignoring major price action defeats the purpose of objective analysis.
- Using too few touch points: A line drawn from just two points is a hypothesis, not a confirmed trend line, until a third touch validates it.
- Ignoring the timeframe: A trend line on a very short timeframe is far less significant than one on a daily or weekly chart.
- Reacting to every minor touch: Not every approach to a trend line results in a bounce. Look for additional confirmation before entering a trade.
- Forgetting to redraw as new data forms: Trend lines should evolve as new swing points appear, rather than staying fixed indefinitely.
For further reading on the history and application of trend line analysis, resources such as Investopedia’s explanation of trend lines and the free lessons available through BabyPips’ educational school offer additional detail and real chart examples worth studying.
Frequently Asked Questions
How many touch points does a valid trend line need?
Most traders consider two points the minimum to draw a line, but a third touch that respects the line adds real confirmation. Until that third touch occurs, the line should be treated as tentative rather than fully validated.
Should trend lines connect wicks or candle bodies?
There’s no universal rule, and traders differ in preference. Connecting wicks captures the full extreme of price action, while connecting bodies can sometimes produce a cleaner, more representative line. Many traders try both and use whichever fits the current chart more naturally.
Can a market have more than one valid trend line at once?
Yes. It’s common to see a shorter-term trend line nested inside a larger, longer-term trend line, especially during pullbacks within a bigger trend. Watching how price interacts with both can offer a more complete picture of market structure.
Practicing Trend Line Drawing
Like most charting skills, trend line drawing improves quickly with repetition. A useful exercise is to open historical charts across a handful of different assets, cover the right-hand side of the screen, and try drawing what you believe the trend line should be based only on the visible price action. Then reveal the rest of the chart and compare your line to how price actually behaved. Repeating this exercise regularly trains your eye to spot valid trend lines faster and with far more consistency.
Final Thoughts
Trend lines remain one of the simplest yet most effective tools in a trader’s toolkit, turning a chaotic-looking chart into a clear visual story of direction and momentum. Once you understand how to identify genuine swing points, connect them correctly, and confirm validity with a third touch, trend lines become a reliable foundation for spotting entries, exits, and early signs of a shifting trend.
Start by practicing on historical charts, pay close attention to the angle and number of touches, and combine your trend lines with candlestick patterns and volume for a more complete trading approach.