How to Identify Support and Resistance Levels
A practical, step-by-step guide to spotting the price levels where markets tend to pause, reverse, or break through.
Support and resistance are two of the very first concepts every trader learns, and for good reason — they show up on every chart, in every market, on every timeframe. Once you know how to identify these levels, price charts stop looking like random zig-zags and start showing clear zones where buyers and sellers have historically fought for control. This guide walks through exactly what these levels are, the different types you’ll encounter, and a step-by-step process for drawing them correctly.
What Are Support and Resistance Levels?
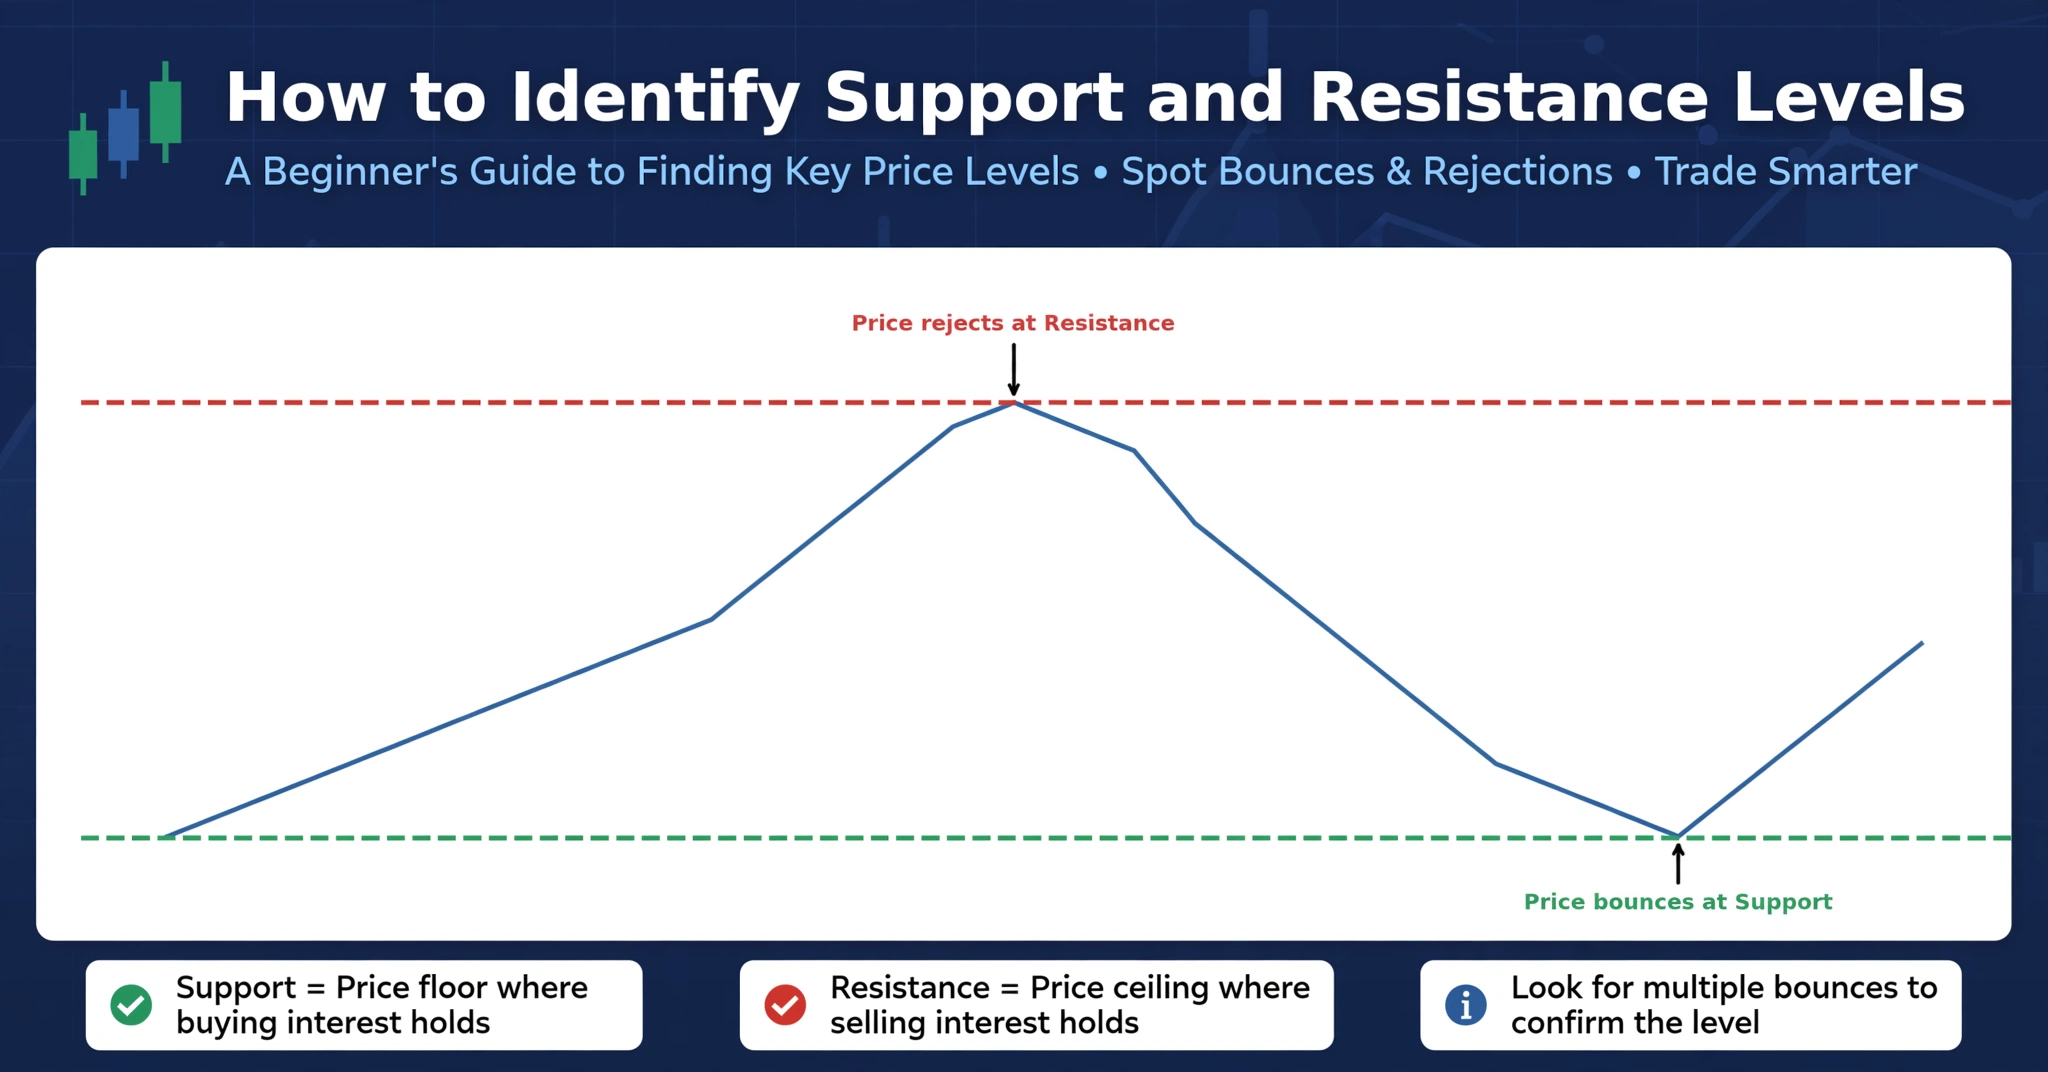
Support is a price level where a falling market has historically found enough buying interest to stop declining and bounce back up. Think of it as a floor that price keeps landing on. Resistance is the opposite — a price level where a rising market has historically met enough selling pressure to stall or reverse. Think of it as a ceiling that price struggles to break through.
These levels form because large numbers of traders remember where price reacted in the past, and they tend to place orders around those same zones again in the future. This creates a kind of self-fulfilling pattern: because enough people expect a reaction at a certain price, their combined buying or selling actually causes that reaction to happen.
Why These Levels Matter So Much
Support and resistance zones give traders a practical framework for making decisions. Instead of guessing where to enter a trade or place a stop-loss, these levels provide logical reference points based on how the market has actually behaved. They’re used to:
- Identify potential entry points near support in an uptrend, or near resistance in a downtrend.
- Set realistic stop-loss levels just beyond a key zone, rather than at an arbitrary distance.
- Set profit targets at the next meaningful support or resistance level.
- Confirm whether a trend is likely to continue or is showing early signs of exhaustion.
Types of Support and Resistance
Not all support and resistance levels look the same. Recognizing the different types will help you build a more complete picture of where the market is likely to react.
Horizontal Support and Resistance
The simplest and most widely used type, formed by connecting two or more price points where the market has previously reversed at roughly the same level. The more times price has respected a horizontal level, the more significant it’s generally considered to be.
Trendline Support and Resistance
Instead of a flat horizontal line, a trendline connects a series of rising lows (support in an uptrend) or falling highs (resistance in a downtrend). Trendlines shift over time, which makes them useful for tracking dynamic, evolving trends rather than a single fixed price.
Psychological or Round-Number Levels
Prices ending in round numbers — such as $50, $100, or $1,000 — often act as informal support or resistance simply because large numbers of traders place orders around these easy-to-remember levels. This is especially common in heavily traded stocks, indices, and cryptocurrencies.
Moving Averages as Support and Resistance
Popular moving averages, such as the 50-day or 200-day, often act as a form of “dynamic” support or resistance because so many market participants watch and react to the same levels. Unlike horizontal lines, a moving average shifts with each new candle.
Fibonacci Retracement Levels
Based on ratios derived from the Fibonacci sequence, these levels — commonly 38.2%, 50%, and 61.8% — are drawn between a recent swing high and swing low. Many traders watch these zones for potential reversal points during a pullback within a larger trend.
How to Draw Support and Resistance Lines Step by Step
- Zoom out first. Start on a higher timeframe, such as the daily or weekly chart, to identify the most significant, long-standing levels before narrowing your focus.
- Look for repeated reactions. Scan the chart for price areas where the market has reversed direction two or more times — these are your candidate levels.
- Connect the closest matching points. Draw a horizontal line connecting the highs (for resistance) or lows (for support) that are closest to the same price, rather than forcing an exact match.
- Treat levels as zones, not exact lines. Markets rarely reverse at the exact same price twice. Give each level a small buffer zone rather than expecting pinpoint precision.
- Repeat on a lower timeframe. Once your major levels are marked, drop down to a shorter timeframe to fine-tune entries around those same zones.
Confirming a Level’s Strength
Not every support or resistance line carries equal weight. A few factors help determine how significant a level really is:
| Factor | What It Tells You |
|---|---|
| Number of touches | The more times price has reversed at a level, the stronger that level is generally considered. |
| Volume at the level | Higher trading volume near a reaction point suggests broader participation and a more reliable level. |
| Timeframe | A level identified on a weekly chart typically carries more weight than the same level on a 5-minute chart. |
| Recency | More recent reactions are usually more relevant than reactions from months or years ago, since market conditions change over time. |
What Happens When a Level Breaks: Role Reversal
One of the most useful concepts in support and resistance analysis is role reversal. When price breaks decisively through a resistance level, that same level often flips and starts acting as support on future pullbacks. The same thing happens in reverse: once support is broken, it frequently becomes resistance the next time price approaches it from below.
Watching for a clean “breakout and retest” of a level is one of the more reliable ways to confirm that a breakout is genuine rather than a temporary false move.
Combining Support and Resistance With Candlestick Patterns
Support and resistance levels become far more powerful when combined with candlestick pattern recognition. A bullish reversal candle forming exactly at a well-tested support zone carries much more weight than the same candle appearing in the middle of nowhere. If you haven’t already, our guide on Candlestick Patterns Every Trader Must Know is the perfect companion to this article, since it explains exactly which formations to watch for at these key levels.
Once you’ve identified a level and spotted a supporting candlestick pattern, it’s also worth running your potential trade through a proper risk framework before entering. Our Risk Reward Calculator makes it easy to check whether a setup around a support or resistance zone actually offers a favorable risk-to-reward ratio before you commit any capital.
Best Timeframes to Identify These Levels
Support and resistance can technically be drawn on any timeframe, but the most reliable levels tend to come from higher timeframes where more market participants have had the opportunity to react. A common approach is to:
- Mark major levels on the weekly or daily chart first, since these reflect broader, longer-term sentiment.
- Use the 4-hour or 1-hour chart to watch how price behaves as it approaches those major levels.
- Reserve very short timeframes, like 5 or 15 minutes, for fine-tuning exact entry and exit timing once the higher-timeframe context is clear.
Common Mistakes Traders Make
- Drawing too many lines: A chart cluttered with dozens of levels becomes useless. Focus on the handful of zones with the clearest, most repeated reactions.
- Expecting pinpoint accuracy: Treating a level as an exact price rather than a zone often leads to premature entries or exits.
- Ignoring the higher timeframe: A minor level on a 5-minute chart can be irrelevant compared to a major level on the daily chart.
- Forgetting about volume: A breakout on weak volume is far more likely to fail than one backed by a genuine surge in participation.
- Not planning for false breakouts: Price often pushes slightly beyond a level before reversing. Waiting for confirmation, such as a retest, can help avoid getting caught in these traps.
For further reading on the theory and historical development of these concepts, resources such as Investopedia’s guide to support and resistance basics and the free lessons available through BabyPips’ educational school offer additional detail and real-world chart examples worth studying.
Frequently Asked Questions
How many times does a level need to be tested before it’s considered valid?
There’s no strict rule, but most traders consider a level meaningfully stronger once price has reacted to it at least two or three times. A single reaction is often just coincidence, while repeated reactions suggest genuine market memory around that price.
Can support and resistance levels fail?
Yes, regularly. No level holds forever, and strong momentum or major news events can push price straight through a previously reliable zone. This is exactly why risk management, such as stop-loss placement, remains essential even around well-tested levels.
Is it better to use horizontal levels or trendlines?
Neither is inherently better — they serve different purposes. Horizontal levels work well for identifying fixed reaction zones, while trendlines are more useful for tracking a market that’s steadily trending in one direction. Most experienced traders use both together.
Practicing on Real Charts
The fastest way to internalize support and resistance is to practice marking levels on historical charts before trying it live. Pick a handful of stocks or currency pairs you’re familiar with, load up a daily chart going back six to twelve months, and mark every level where price clearly reversed two or more times. Then scroll forward and watch how price actually behaved around those levels — did it bounce, break through, or chop sideways for a while first?
Repeating this exercise across different assets and market conditions builds an intuitive sense for which levels tend to hold and which ones are more likely to break. Over time, you’ll start recognizing strong zones almost instantly, without needing to consciously count touches or measure distances.
Final Thoughts
Support and resistance levels form the backbone of technical chart reading. Once you know how to spot horizontal zones, trendlines, psychological levels, and dynamic moving averages, you’ll start noticing the same reaction points that experienced traders have relied on for decades.
Start by marking the clearest, most repeated levels on a higher timeframe, watch how price reacts as it approaches them, and combine that context with candlestick patterns and proper risk management before entering any trade.