
Getting started with uCharts is simple, even if you are completely new to online charting platforms and market analysis tools. Creating an account allows you to access the uCharts dashboard, explore advanced charting features, monitor markets, and personalize your trading experience.
In this beginner-friendly guide, you’ll learn how to create a uCharts account, verify your profile, access the dashboard, and start using the platform efficiently.
What Is uCharts?
uCharts is an online charting and market analysis platform designed for traders, investors, and beginners who want to analyze financial markets using interactive charts and technical indicators.
The platform helps users:
- analyze market trends
- study price action
- track assets
- monitor trading opportunities
- use technical indicators
- improve technical analysis skills
Whether you are interested in cryptocurrencies, stocks, forex, or other financial markets, uCharts provides a modern interface for chart-based analysis.
Why Create an Account on uCharts?
Creating an account gives you access to important platform tools and personalization features.
Benefits of having a uCharts account include:
- access to interactive trading charts
- customizable watchlists
- technical indicators
- saved chart layouts
- personalized dashboard settings
- multi-device access
- market monitoring tools
An account also allows you to organize your trading environment more efficiently.
Step-by-Step Guide to Creating a uCharts Account
Follow these steps to register your account on uCharts
Step 1 — Visit the Official uCharts Website
Open your browser and go to:
uCharts.com
Once the homepage loads, look for options such as:
These buttons are usually visible in the website header or homepage section.
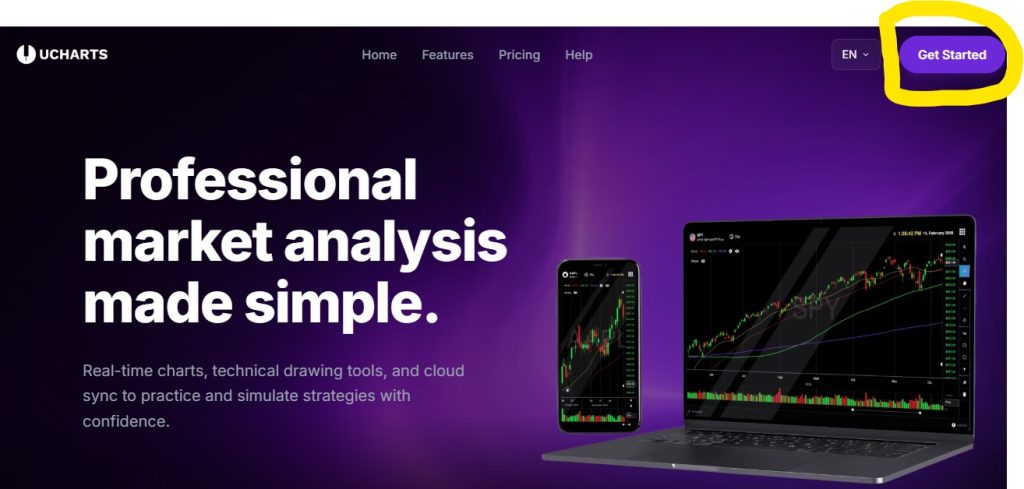
Step 2 — Click Getting Started-Up Button
Click the registration button to open the account creation form.
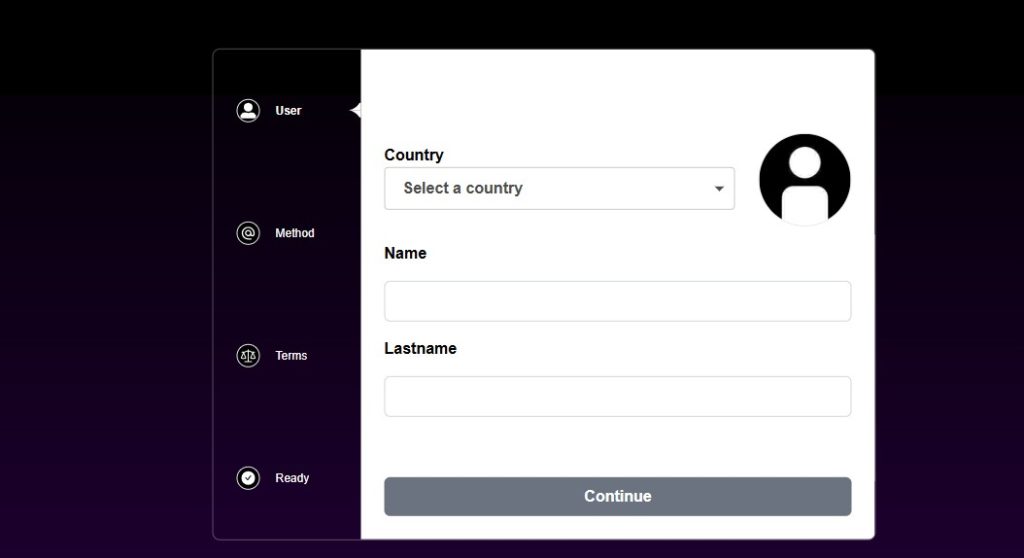
You may be asked to provide:
- Choose Country
- your full name
- email address (Choose Gmail or Just Email)
- Approve Terms and Conditions
- username
- password
- Choose Plan

Make sure all information is entered correctly to avoid verification problems later.
Step 3 — Create a Secure Password
A strong password helps protect your account and personal data.
For better security, your password should contain:
- uppercase letters
- lowercase letters
- numbers
- special characters
Example format:
StrongPassword123!Avoid using:
- birthdays
- easy words
- repeated numbers
- simple combinations
Strong passwords reduce the risk of unauthorized access.
Step 4 — Verify Your Email Address
After registration, uCharts may send a verification email to confirm your account.
To complete verification:
- Open your email inbox
- Locate the verification email
- Click the confirmation link
- Return to uCharts.com
If the email does not appear immediately:
- check your spam folder
- check promotions tab
- wait a few minutes
- request another verification email
Verification helps improve account security and confirms ownership of the account.
Step 5 — Log Into your uCharts Account
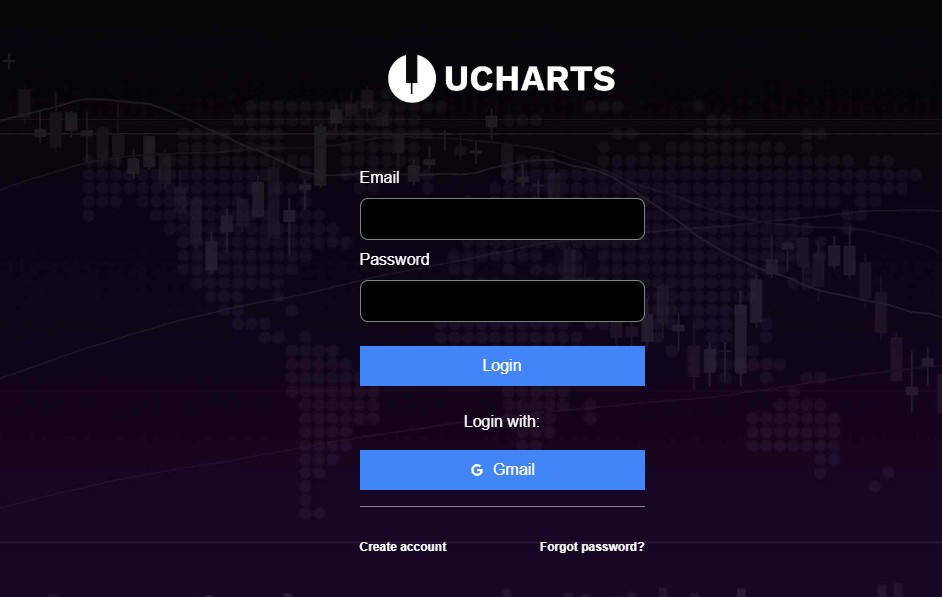
Once your email is verified:
- Return to the login page
- Enter your username or email
- Enter your password
- Click Login
You should now have access to the uCharts dashboard.
Understanding the uCharts Dashboard
After logging in, you’ll enter the main uCharts dashboard where market analysis and charting tools are available.
The dashboard may include:
- live charts
- technical indicators
- watchlists
- market overview panels
- chart settings
- navigation menus
This is the main workspace where traders monitor and analyze market activity.
Beginner Onboarding: What to Do After Creating Your Account
New users should focus on learning the basics before exploring advanced tools.
Customize Your Dashboard
uCharts allows users to personalize their workspace.
You may be able to:
- rearrange chart panels
- create watchlists
- change themes
- save chart templates
- organize favorite assets
Custom layouts improve trading efficiency and user experience.
Learn Basic Chart Navigation
Spend time understanding:
- chart zoom controls
- timeframe switching
- indicator menus
- drawing tools
- chart layouts
Learning these basics will make market analysis easier.
Add Technical Indicators
Technical indicators help traders analyze momentum, volatility, and trend direction.
Popular beginner indicators include:
- RSI (Relative Strength Index)
- Moving Averages
- MACD
- Bollinger Bands
Start with one or two indicators instead of adding too many at once.
Create Your First Watchlist
Watchlists help users monitor selected assets more efficiently.
Popular assets traders often track include:
- Bitcoin
- Ethereum
- altcoins
- forex pairs
- stocks
- commodities
This allows you to focus on specific markets and opportunities.
Explore Different Timeframes
Timeframes are essential in technical analysis.
Common chart intervals include:
- 1-minute
- 5-minute
- 1-hour
- 4-hour
- daily
- weekly
Shorter timeframes are often used by day traders, while longer timeframes are useful for swing traders and investors.
Common Registration Problems and Fixes
Some users may encounter minor issues during signup.
Verification Email Not Received
Possible solutions:
- check spam folder
- confirm correct email spelling
- wait a few minutes
- resend verification email
Login Problems on ucharts
Ensure your password:
- meets minimum requirements
- includes symbols and numbers
- is long enough
Unable to Access Dashboard
Try:
- refreshing the page
- clearing browser cache
- using another browser
- resetting your password
Tips for New uCharts Users
If you are new to charting platforms, these beginner tips can help.
Start Simple
Avoid using too many indicators immediately.
Focus first on:
- trend direction
- support and resistance
- candlestick patterns
- price movement
Learn Technical Analysis Basics
Understanding core concepts improves your ability to use charting platforms effectively.
Important topics include:
- RSI
- MACD
- moving averages
- chart patterns
- trendlines
- market structure
Practice Before Taking Big Risks
Spend time learning charts and market behavior before making aggressive trading decisions.
Building analytical skills takes time and consistency.
Is uCharts Good for Beginners?
Yes, uCharts is designed to be beginner-friendly while still offering advanced charting capabilities for experienced users.
The platform focuses on:
- easy navigation
- clean dashboard layouts
- accessible charting tools
- technical analysis features
- customizable workspaces
This balance makes it easier for beginners to start learning market analysis without feeling overwhelmed.
Final Thoughts
Creating an account on uCharts is the first step toward exploring interactive charting tools and technical market analysis.
The signup process is straightforward:
- Visit the official website
- Create your account
- Verify your email
- Access the dashboard
- Start exploring charts and indicators
For beginners, the best approach is to start slowly, learn the platform layout, and gradually develop technical analysis skills over time.
As you become more comfortable with chart reading and market analysis, uCharts can become a valuable platform for tracking financial markets and improving trading workflows.