How to Research Stocks Before Investing (Complete Guide)
A practical, step-by-step framework for evaluating a company’s business, financials, charts, and risk before you buy a single share.
Buying a stock takes seconds. Understanding what you actually bought can take hours — and that gap is exactly where most losses come from. Investors who skip research tend to chase price momentum, react to headlines, or copy a stock tip without knowing whether the company behind it is even healthy. This guide walks through a complete, repeatable process for researching stocks before investing, from reading financial statements to interpreting price charts and managing risk.
Why Stock Research Matters
Every share of stock represents partial ownership in a real business. When you buy without research, you are essentially trusting that someone else — a friend, a forum, a headline — has already done the homework for you. That trust is rarely well placed. Markets are driven by millions of participants with different time horizons, and short-term price movement often has little to do with a company’s actual financial health.
It also helps to remember that stock prices are forward-looking. A company can report strong current earnings and still see its share price fall, simply because the market expected even more. This is one reason research needs to go beyond headline numbers and into the trend behind them — whether growth is accelerating or decelerating, and whether current results confirm or contradict the company’s own guidance.
Proper research reduces two kinds of risk: the risk of overpaying for a weak business, and the risk of misunderstanding what you own well enough to hold through normal volatility. Investors who understand a company’s fundamentals are far less likely to panic-sell during a routine pullback, because they can distinguish between a temporary price dip and a genuine deterioration in the business.
Step 1: Understand the Business Model
Before opening a single financial statement, get clear on what the company actually does. This sounds obvious, but a surprising number of investors buy stocks in businesses they cannot explain in one sentence.
Read the Company Overview
Start with the company’s own description of itself, usually found in its annual report or investor relations page. Identify the core products or services, the primary customer base, and the geographic markets it operates in. A company selling cloud software to enterprises behaves very differently from one manufacturing industrial equipment, even if both show similar revenue growth on paper.
Identify Revenue Streams
Break down how the company earns money. Is revenue concentrated in one product, or diversified across several? Is it recurring, like subscriptions, or one-off, like project-based contracts? Recurring revenue tends to be more predictable and is generally viewed more favorably, since it reduces the company’s dependence on constantly winning new business.
Step 2: Analyze Financial Statements
Once you understand the business, move into the numbers. Public companies are required to publish three core financial statements, and each tells a different part of the story.
Income Statement
The income statement shows revenue, expenses, and profit over a period of time. Look for consistent revenue growth, stable or improving profit margins, and expenses that scale sensibly with sales. A company with rising revenue but shrinking margins may be growing at the expense of profitability, which is worth investigating further.
Balance Sheet
The balance sheet is a snapshot of what the company owns (assets) and owes (liabilities) at a specific point in time. Compare total debt to equity, and check whether cash reserves are sufficient to cover short-term obligations. A heavily indebted company can still be a reasonable investment, but the debt load should match the stability of its cash flow.
Cash Flow Statement
Profit on paper is not the same as cash in the bank. The cash flow statement reveals how much actual cash the business generates from operations, and how it is being used — reinvested into growth, paid out as dividends, or used to reduce debt. Consistently positive operating cash flow is one of the clearest signs of a fundamentally sound business.
| Statement | What It Reveals | Key Thing to Check |
|---|---|---|
| Income Statement | Profitability over time | Revenue growth and margin trend |
| Balance Sheet | Financial position at a point in time | Debt levels vs. equity and cash |
| Cash Flow Statement | Actual cash generated and spent | Positive operating cash flow |
Step 3: Study Key Financial Ratios
Ratios let you compare companies of different sizes on equal footing, and they help place a company’s numbers in context against its own history and its industry peers.
Valuation Ratios
The price-to-earnings (P/E) ratio and price-to-sales (P/S) ratio indicate how much investors are paying for each dollar of earnings or revenue. A high ratio is not automatically bad, but it usually signals that the market expects strong future growth — growth that needs to actually materialize to justify the price.
Profitability Ratios
Metrics like return on equity (ROE) and net profit margin show how efficiently a company converts revenue and shareholder capital into profit. Comparing these against industry averages helps identify businesses with a genuine competitive advantage.
Liquidity and Debt Ratios
The current ratio and debt-to-equity ratio measure a company’s ability to meet short-term obligations and how leveraged it is. These matter most during economic downturns, when weaker balance sheets tend to struggle first.
Step 4: Read Stock Charts and Price Trends
Fundamentals tell you whether a business is sound; charts tell you how the market is currently pricing that business. Understanding basic chart structure helps you time entries more sensibly and avoid buying into an overextended rally or a downtrend that hasn’t stabilized yet.
If you are new to reading price charts, it helps to first understand the anatomy of a stock chart — the difference between price axes, volume bars, and time frames — before layering on technical indicators. Our guide on what a stock chart is and how it works breaks this down for beginners and pairs well with the fundamental research covered in this guide.
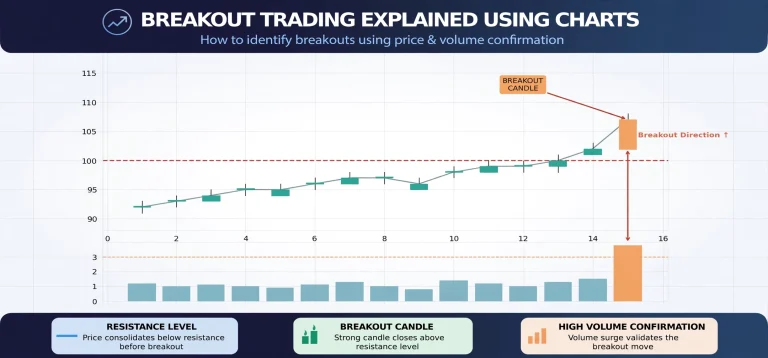
Once the basics are clear, pay attention to the overall trend direction, recent volume patterns around price moves, and how the stock has historically reacted near key support and resistance zones. None of this replaces fundamental research, but it adds useful context on timing.
Step 5: Evaluate Management and Industry Position
Numbers describe the past; management decisions shape the future. Look into how long the current leadership team has been in place, whether insiders own meaningful amounts of stock (which aligns their incentives with shareholders), and how the company has navigated previous industry downturns.
Also assess competitive position. Does the company have a durable advantage — brand strength, proprietary technology, cost leadership, or high switching costs for customers — or is it competing purely on price in a crowded market? Businesses with a genuine moat tend to sustain profitability longer than those without one.
Step 6: Check News, Filings, and Analyst Opinions
Recent news can shift the short-term outlook even for a fundamentally strong company, so it’s worth checking for pending litigation, regulatory changes, management shake-ups, or shifts in guidance. For primary-source accuracy, official regulatory filings are far more reliable than secondhand summaries.
In the United States, company filings such as annual and quarterly reports are publicly available through the SEC’s EDGAR database, and general investor education material can be found through Investor.gov. These government resources are useful starting points for verifying claims before relying on secondary commentary.
Analyst opinions can be a helpful data point, but they should never replace your own research. Analysts frequently disagree with each other, and price targets are estimates, not guarantees. Treat a cluster of analyst upgrades or downgrades as a prompt to dig deeper into the underlying reason, rather than as a signal to act on immediately.
It also helps to set up a simple monitoring routine once you own a stock, rather than treating research as a one-time task. Quarterly earnings releases, major product announcements, and shifts in industry regulation can all change the thesis you originally built. Revisiting your research every few months keeps your understanding of the business current, instead of relying on an assessment that may already be outdated.
Step 7: Assess Risk and Position Sizing
Even a well-researched stock can move against you in the short term. This is why risk management is not optional — it is the part of research that protects your capital when the analysis turns out to be wrong, or when the market simply behaves irrationally for longer than expected.
Before entering a position, decide how much of your portfolio you are willing to allocate, and where you would exit if the trade does not work out. Rather than guessing at position size, it helps to run the numbers through a dedicated tool. Our Risk Reward Calculator can help you evaluate whether a potential trade’s upside justifies its downside before you commit capital.
Common Mistakes to Avoid
- Relying on a single data point. A low P/E ratio or a bullish headline alone is not enough justification to buy.
- Ignoring debt levels. A company can show strong revenue growth while quietly building an unsustainable debt load.
- Chasing price momentum. Buying purely because a stock is “going up” without understanding why is speculation, not investing.
- Skipping risk management. Even accurate research doesn’t guarantee a winning trade every time; position sizing protects you when it doesn’t work out.
- Confusing analyst opinions with facts. Ratings and price targets are forecasts, not certainties.
Final Thoughts
Researching a stock properly means looking at the business, the numbers, the chart, and the risk — together, not in isolation. It takes more effort than acting on a tip, but it is the difference between investing with a plan and gambling with a ticker symbol. Build this process into a habit, and apply it consistently to every stock you consider, regardless of how strong the initial pitch sounds.
For more on reading price action once your fundamental research is complete, explore our guide on stock charts, and use the Risk Reward Calculator to size your positions responsibly.