Top Factors That Influence Stock Prices in the Market
A practical breakdown of the real forces — fundamental, economic, and psychological — that push stock prices up or down every trading day.
Stock prices move every single trading day — sometimes by a fraction of a percent, sometimes by double digits. But what actually pushes a price up or down? Understanding the forces behind these movements helps traders and investors make calmer, more confident decisions instead of reacting emotionally to every red or green candle.
In this guide, we break down the most important factors that influence stock prices — from company fundamentals and economic data to investor psychology and global events. Whether you’re trying to understand why your favorite stock dropped overnight, or you’re refining an existing strategy, this article gives you a clear, practical view of what really drives price action.
Stock prices are ultimately decided by supply and demand — but that supply and demand is shaped by earnings, economic data, interest rates, sentiment, news, and macro trends. No single factor works in isolation; they constantly interact with one another.
Supply and Demand: The Foundation of Every Price Move
At its core, every stock price is simply a reflection of supply and demand. When more investors want to buy a stock than sell it, the price rises. When more investors want to sell than buy, the price falls. This basic principle sits underneath every other factor on this list — earnings reports, news, and economic data all matter because they change how many people want to buy or sell a stock at a given price.
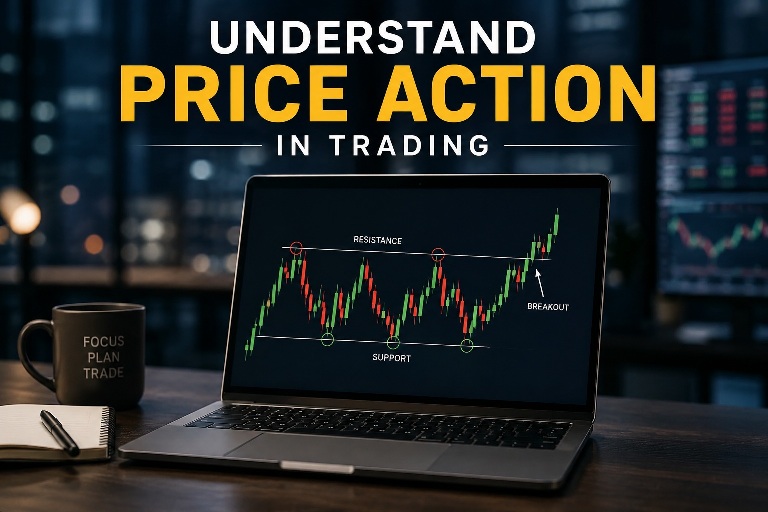
This is also why understanding chart behavior is valuable on its own. For a simple, no-fluff breakdown of how prices actually move tick by tick, see our guide on understanding price action in trading, which explains how supply and demand show up directly on the chart.
Company Earnings and Financial Performance
A company’s quarterly earnings report is one of the biggest short-term price movers. When a company beats expectations on revenue, margins, or guidance, its stock often jumps immediately. Missing expectations — even slightly — can trigger a sharp sell-off, regardless of long-term fundamentals.
Key metrics investors watch
- Earnings per share (EPS): Profit allocated to each outstanding share.
- Revenue growth: Whether the company is expanding its top line.
- Profit margins: How efficiently revenue turns into profit.
- Forward guidance: Management’s outlook for the next quarter or year.
- Debt levels: How much leverage the company is carrying.
Markets are forward-looking, which is why prices often react more to guidance and future expectations than to the actual historical numbers being reported.
Interest Rates and Central Bank Policy
Interest rate decisions from central banks, such as the Federal Reserve, have a massive ripple effect across global stock markets. When rates rise, borrowing becomes more expensive, consumer spending tends to slow, and bonds become more attractive relative to stocks — often pushing prices lower, especially for growth and technology names.
When rates fall, the opposite tends to happen: cheaper borrowing, increased spending, and a higher relative appeal of equities over fixed income, which generally supports valuations.
Interest rate announcements are some of the most anticipated events of the year. Many traders mark central bank meeting dates well in advance because volatility around these announcements can be significant.
Inflation and Economic Indicators
Inflation data, employment reports, GDP growth, and consumer confidence all shape how investors view the broader economy — and by extension, corporate profitability. High inflation erodes purchasing power and squeezes margins, which can weigh on prices. Strong employment and GDP growth usually signal a healthy economy that supports rising earnings and valuations.
| Indicator | What It Measures | Typical Market Impact |
|---|---|---|
| Consumer Price Index (CPI) | Inflation rate of goods and services | Higher-than-expected CPI can pressure prices |
| Non-Farm Payrolls | Job creation in the economy | Strong data boosts confidence but can raise rate-hike fears |
| GDP Growth | Overall economic output | Higher growth generally supports prices |
| Consumer Confidence Index | Household sentiment on spending | Higher confidence often lifts demand for stocks |
Market Sentiment and Investor Psychology
Stock prices aren’t driven by numbers alone — human emotion plays a massive role. Fear and greed often push prices well beyond what fundamentals justify, in both directions. During optimism, investors may pay a premium regardless of valuation; during panic, even strong companies can see sharp declines as investors rush to sell.
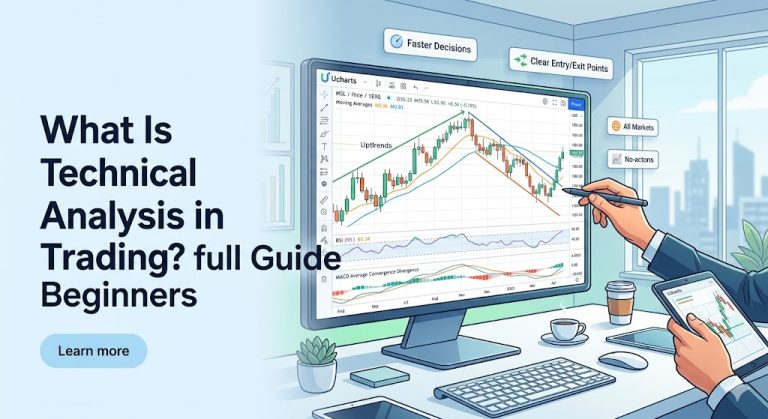
This is why technical analysis — studying price trends and trader behavior rather than fundamentals — has become such a popular tool. If you’re new to this, our detailed resource on technical analysis in trading walks through how chart patterns and indicators help traders read sentiment in real time.
Industry and Sector Trends
Stocks rarely move in isolation from their industry. If an entire sector faces headwinds — rising input costs, regulatory changes, shifting consumer preferences — most companies within it feel some impact, even strong performers. A sector experiencing a tailwind, like renewable energy during a period of incentives, can lift even mediocre companies within that space.
Comparing a stock’s performance against its sector and broader index helps determine whether a price move is company-specific or part of a wider trend.
News, Media Coverage, and Public Perception
Breaking news — product launches, lawsuits, leadership changes, mergers, or scandals — can move stock prices within minutes. Social media has amplified this effect, with viral posts or influential commentary sometimes triggering rapid, sentiment-driven swings that may not reflect a company’s actual financial health.
This is part of why short-term price action can look chaotic even when the underlying business hasn’t changed. Separating noise from meaningful news is one of the most valuable skills an investor can develop.
Geopolitical Events and Global Uncertainty
Wars, elections, trade tensions, sanctions, and political instability all introduce uncertainty into markets, and markets generally dislike uncertainty. Geopolitical shocks can trigger broad sell-offs across entire markets — not just specific stocks — as investors rotate toward safer assets like gold, government bonds, or cash.
Multinational companies are particularly sensitive to geopolitical risk since supply chains, trade agreements, and currency exposure can all be disrupted by political developments in the countries where they operate or source materials.
Currency Exchange Rates
For companies with significant international operations, currency fluctuations can meaningfully affect reported earnings. A stronger domestic currency can make exports more expensive and less competitive abroad, while a weaker currency can boost overseas revenue when converted back home. Investors in multinational stocks need to factor in currency risk alongside traditional fundamentals.
Dividends and Stock Buybacks
Companies that pay consistent or growing dividends often attract a loyal base of income-focused investors, which can provide price stability during volatile periods. A dividend cut is usually viewed as a red flag and can trigger a sharp decline, since it often signals underlying financial stress.
Stock buybacks have a similar effect — by reducing shares outstanding, buybacks can increase earnings per share and signal management’s confidence, often supporting the stock price.
Liquidity and Trading Volume
Stocks with low trading volume tend to experience more dramatic swings, because even relatively small orders can have an outsized impact on price. Highly liquid stocks — large-cap names on major exchanges — generally see smoother, more gradual movement because more buyers and sellers are available to absorb large orders.
Recognizing how trends and momentum build on a chart is closely tied to liquidity. If you’re working on reading these patterns more confidently, this guide on how to read stock market trends like a professional trader is a useful next step.
Regulatory and Government Policy Changes
New regulations, tax policy changes, antitrust actions, or industry-specific legislation can significantly shift a company’s cost structure or competitive position. Healthcare, banking, energy, and technology are among the sectors most sensitive to regulatory shifts, since government policy can directly affect how these businesses generate revenue.
Stock prices are rarely driven by a single factor in isolation. A strong earnings report might be overshadowed by a surprise rate hike. Positive economic data might be ignored if geopolitics dominates headlines. Successful investors combine fundamental analysis, technical analysis, and macro awareness rather than relying on just one signal.
Want to track these factors in real time across stocks, forex, and crypto? UCharts gives you professional-grade charting tools to follow price action as it happens.
Try UCharts FreeFrequently Asked Questions
What is the single biggest factor that affects stock prices?
There isn’t one dominant factor — it depends on the timeframe. In the short term, news and sentiment often drive prices; in the long term, earnings growth and fundamentals tend to matter most.
Can stock prices move without any news?
Yes. Prices can move purely from supply and demand dynamics, large institutional orders, options expiration, or shifts in overall sentiment, even without a specific catalyst.
How do interest rates affect stock prices?
Higher rates generally make borrowing more expensive and bonds more attractive, which can reduce demand for stocks. Lower rates tend to have the opposite effect, often supporting higher equity prices.
Do all stocks react the same way to economic news?
No. Different sectors and companies react differently based on their business model, debt levels, and sensitivity to interest rates, inflation, or consumer spending.
Final Thoughts
Stock prices are shaped by a complex mix of company performance, economic data, interest rates, investor psychology, and global events. No single factor tells the whole story — the market is a constant interaction between fundamentals and human behavior. The more you understand these forces, the better equipped you’ll be to interpret price movements rather than simply reacting to them.
For deeper guides on reading charts, understanding trends, and improving your trading decisions, explore more resources on UCharts.