How to Use Financial Statements in Investment Research
A practical walkthrough of the income statement, balance sheet, and cash flow statement — and how to turn them into an actual investment decision.
Financial statements are the closest thing an investor has to a company’s actual report card. They’re published quarterly and annually, audited to a standard, and available to anyone willing to read them. Yet most retail investors skip straight to a stock’s price chart or a headline P/E ratio without ever opening the statements those numbers came from. This guide walks through how to actually use financial statements in investment research — what each one tells you, how they connect to each other, and how to spot warning signs before they show up in the stock price.
None of this requires an accounting background. The statements themselves follow a consistent structure across companies and industries, which means once you understand how to read one company’s filings, that same skill transfers directly to the next company you research.
The Three Statements at a Glance
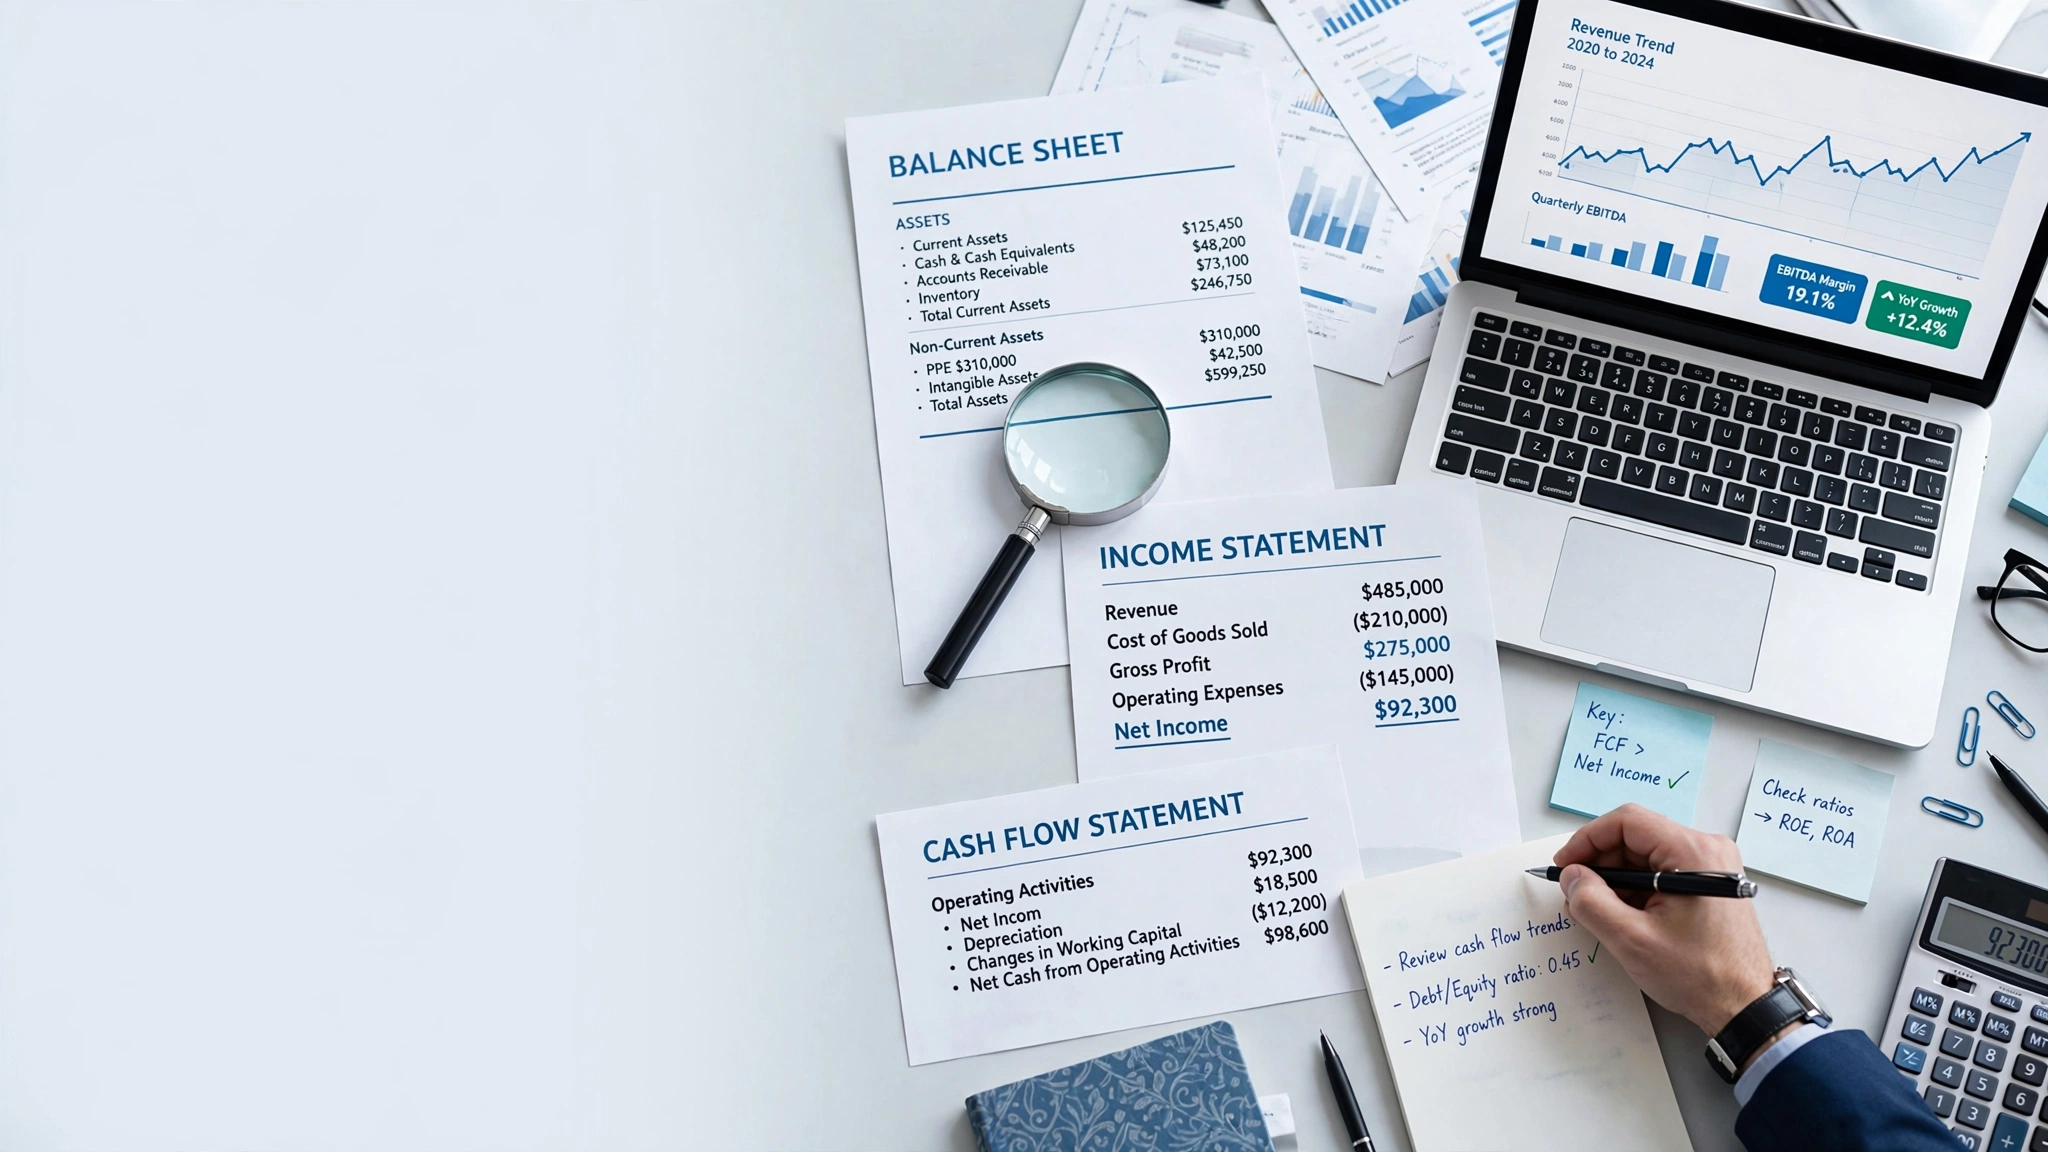
Every public company files three core financial statements, and together they form a complete picture of financial health. Understanding what each one measures — and how they connect — is the starting point for any serious research process.
Think of them as three different camera angles on the same subject. No single angle gives you the whole picture, but combined, they leave very little hidden about how a company is actually performing.
Income Statement
Revenue, expenses, and profit over a period. Answers: is the business profitable?
Balance Sheet
Assets, liabilities, and equity at a point in time. Answers: how is it financed?
Cash Flow Statement
Actual cash generated and spent. Answers: where does the money really go?
Reading the Income Statement
The income statement, sometimes called the profit and loss statement, shows how much a company earned and spent over a specific period — usually a quarter or a fiscal year. It’s the most commonly referenced statement, but also the easiest to misread if you stop at the headline profit figure.
Start with Revenue, Not Profit
Before looking at profit, check whether revenue is actually growing, and whether that growth is broad-based or concentrated in a single product line or region. Revenue is harder to manipulate through accounting choices than profit, which makes it a more reliable starting signal.
Track the Margin, Not Just the Number
Profit margin — profit as a percentage of revenue — tells you more than the raw profit figure alone. A company can grow profit simply by growing revenue, even while margins quietly shrink. Watching the margin trend across several quarters reveals whether the business is becoming more or less efficient over time.
Reading the Balance Sheet
The balance sheet is a snapshot, not a flow — it shows what a company owns and owes at a single moment, rather than performance over a period. This makes it the right place to assess financial stability and risk.
Assets vs. Liabilities
Assets include cash, inventory, equipment, and other resources the company controls. Liabilities include debt and other obligations it owes. The difference between the two is shareholder equity — effectively, what would be left over for owners if the company settled everything it owed today.
Debt Levels in Context
Debt isn’t automatically a red flag. Many strong, stable businesses use debt productively to fund growth at a lower cost than issuing new equity. What matters is whether the company’s cash flow comfortably supports its debt payments, and whether the debt load has been rising faster than the business itself.
Reading the Cash Flow Statement
The cash flow statement is often the most overlooked of the three, and arguably the hardest to manipulate through accounting choices — which makes it especially valuable for spotting the gap between reported profit and actual financial health.
Operating Cash Flow
This section shows cash generated from the company’s core business operations. Consistently positive and growing operating cash flow is one of the strongest signs of a fundamentally sound company, since it reflects real money coming in, not just an accounting profit figure.
Investing and Financing Activities
The investing section shows spending on long-term assets like equipment or acquisitions. The financing section shows activity like issuing debt, repaying loans, or returning cash to shareholders through dividends and buybacks. Reviewing both reveals what management is prioritizing with the company’s cash.
| Section | What to Check | Signals to Watch |
|---|---|---|
| Income Statement | Revenue and margin trend | Growth broad-based, not one-off |
| Balance Sheet | Debt relative to equity and cash | Manageable, stable debt load |
| Cash Flow Statement | Operating cash flow trend | Positive and consistent |
Connecting the Three Statements
The real value of financial statement analysis comes from reading all three together, not in isolation. A company reporting strong profit on the income statement but weak or negative operating cash flow deserves closer scrutiny — the disconnect can signal aggressive revenue recognition or deteriorating collections from customers.
Similarly, a rising debt figure on the balance sheet should be checked against the cash flow statement to see whether the borrowed money is funding productive investment or simply covering shortfalls from weak operating performance.
This cross-referencing habit is what separates surface-level reading from real analysis. Anyone can glance at a profit figure and call it good news; checking whether that profit is backed by real cash and a stable balance sheet is what actually tells you whether the good news is likely to continue.
Don’t Skip the Footnotes
The numbers on the main statements are summaries — the footnotes explain how those numbers were calculated, including accounting policies, one-time charges, pending litigation, and details on debt structure. Skipping the footnotes means missing context that can materially change how a headline number should be interpreted.
This doesn’t mean reading every footnote in full for every company. Focus on sections covering revenue recognition policy, significant debt terms, and any mention of related-party transactions or contingent liabilities, since these are the areas most likely to hide something the headline numbers don’t fully capture.
A company that consistently buries important context deep in dense footnote language, rather than addressing it clearly in the main discussion, is also worth noting as a soft signal — it doesn’t automatically mean something is wrong, but it warrants a closer, more careful read than usual.
Turning Statements into a Research Decision
Reading financial statements is only useful if it feeds into an actual decision process. A simple, repeatable approach works better than trying to master every line item on the first pass.
- Check revenue and margin trend across the last several quarters on the income statement.
- Review debt levels relative to equity and cash reserves on the balance sheet.
- Confirm operating cash flow is positive and roughly tracks reported profit.
- Scan the footnotes for anything unusual — one-time charges, pending legal issues, or changes in accounting policy.
- Combine this with valuation and chart context before deciding on timing.
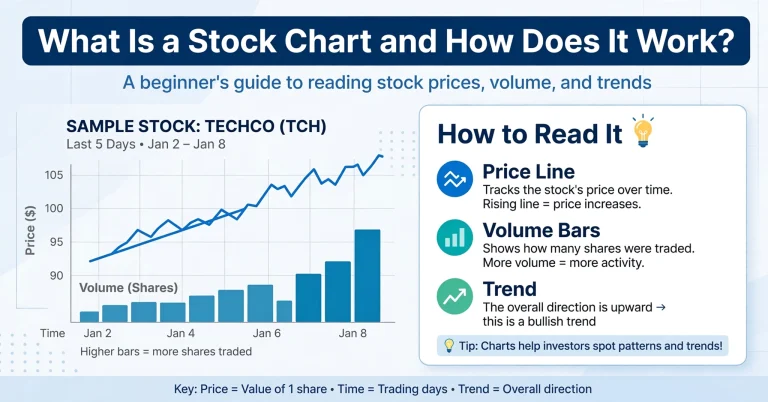
Once the fundamentals check out, it also helps to review the stock’s price behavior before deciding on entry timing. Understanding what a stock chart is and how it works gives useful context for judging whether the current price makes sense relative to recent trend, even after the underlying business has passed your fundamental checks.
Verifying with Primary Sources
Financial data aggregated on third-party sites can occasionally lag or misstate figures, particularly right after earnings releases. For anything that matters to your decision, cross-check against the company’s original filing rather than relying solely on a summarized version.
In the United States, official filings are publicly available through the SEC’s EDGAR database. For background on the accounting standards that govern how these statements are prepared, the Financial Accounting Standards Board (FASB) publishes the rules companies follow when reporting their numbers — useful context for understanding why statements are structured the way they are.
Common Mistakes to Avoid
- Reading only the headline numbers. Profit and revenue alone miss the context that margins, cash flow, and footnotes provide.
- Ignoring the cash flow statement entirely. It’s often the clearest signal of whether reported profit reflects real financial health.
- Judging one quarter in isolation. Trends across several periods are far more informative than a single snapshot.
- Skipping the footnotes. Important context about accounting choices and risks is often buried here, not in the headline figures.
- Never cross-checking third-party data. Always confirm meaningful figures against the company’s actual filing when it matters to your decision.
Once you’re comfortable with the statements and ready to act on a well-researched idea, it also pays to plan the trade itself rather than sizing a position arbitrarily. Learning more about our platform’s approach to research, covered in our piece on Ucharts and data visualization for investors, shows how charting and statement analysis can work together in one workflow.
Bringing It All Together
Financial statements are not just compliance documents — they’re the most direct source of truth about a company’s actual performance. Reading the income statement, balance sheet, and cash flow statement together, then checking the footnotes for anything unusual, gives you a far more reliable foundation than reacting to price movement or headlines alone.
Make this a habit rather than a one-time exercise, and it will steadily improve the quality of every investment decision you make going forward.
To put this into practice, size your next position responsibly with the Position Size Calculator, and review how Ucharts approaches data visualization for investors to see how research and charting fit together.