UCharts · Stocks
Stock Screening Strategies for Beginners and Professionals
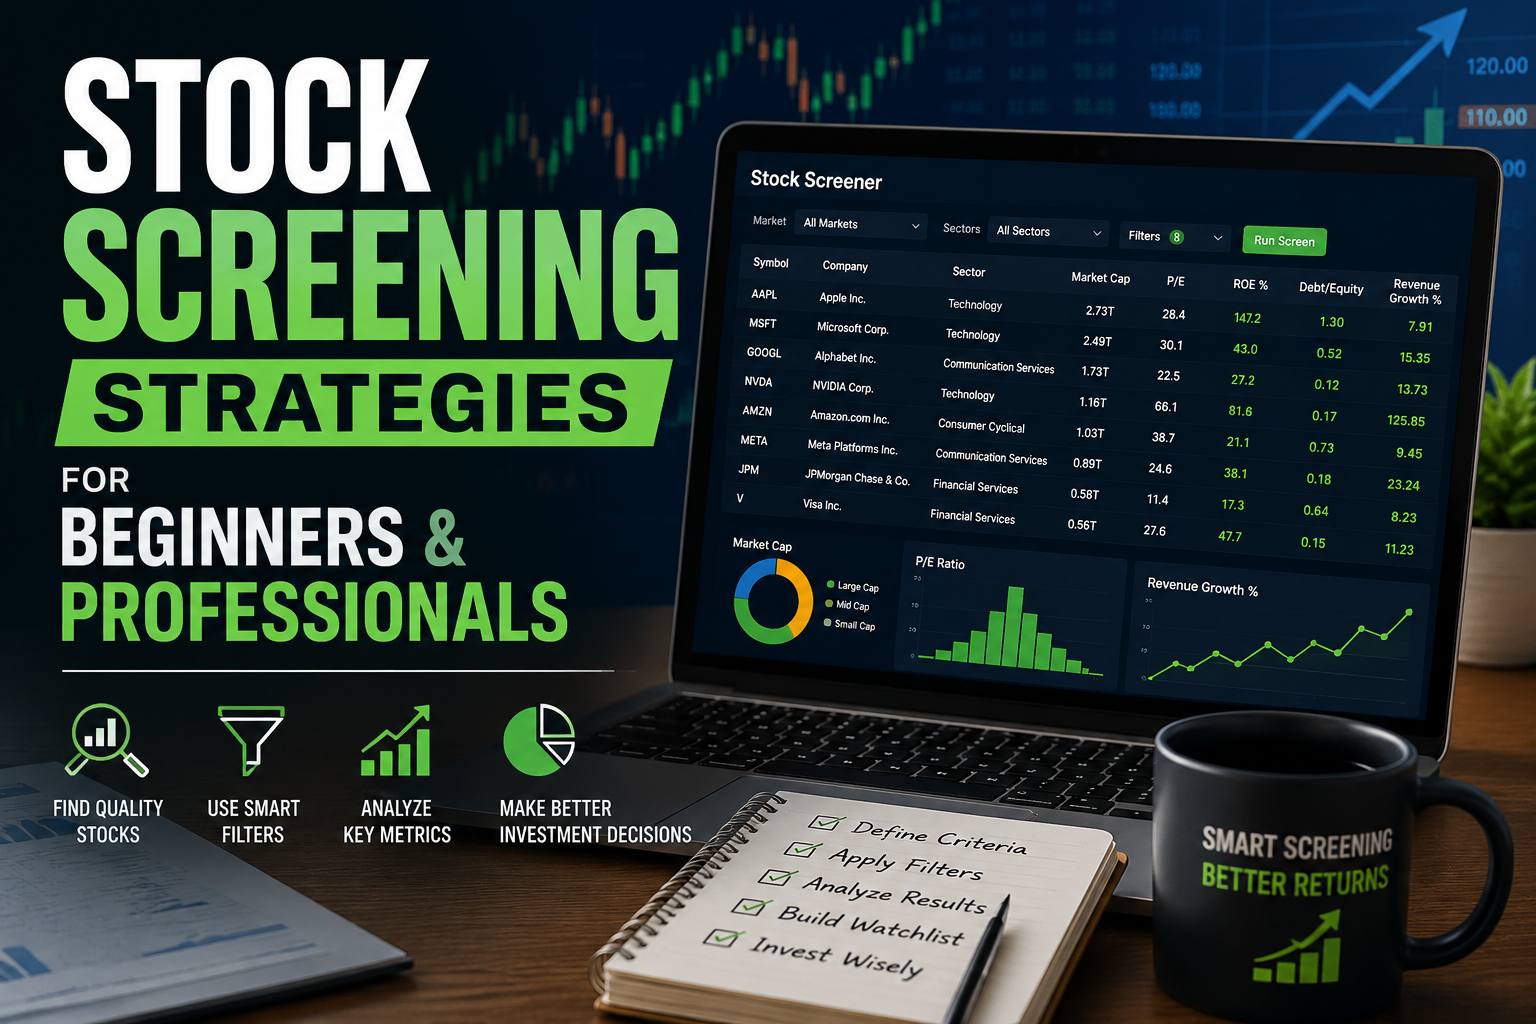
A complete, filter-by-filter guide to narrowing thousands of stocks down to the handful actually worth your research time — whichever experience level you’re starting from.
Every trading day, thousands of stocks move — but only a small fraction match any single trader’s goals, risk tolerance, or timeframe. Stock screening is the process of using specific, repeatable criteria to filter that entire universe down to a manageable, relevant shortlist. Done well, it saves hours of manual research and keeps decisions consistent. Done poorly, it either buries you in noise or filters out the exact opportunities you were looking for in the first place.
This guide breaks screening down into two tracks: a foundation for beginners who are building their first filters, and a set of more advanced, multi-factor approaches for traders and analysts who already understand the basics and want sharper, more disciplined results. Along the way, we’ll cover the metrics that matter most, the mistakes that quietly undermine even well-built screens, and a checklist you can reuse every time you sit down to research.
Why Stock Screening Matters
A stock screener applies rules — such as market capitalization, price-to-earnings ratio, or trading volume — across an entire exchange and returns only the companies that satisfy them. Instead of scrolling through headlines, social media chatter, or guessing at tickers based on what’s trending, you start from a filtered list that already reflects your strategy and risk profile.
This matters more as markets get noisier. Screening turns a vague goal like “find undervalued small caps” or “find momentum names before they break out” into a repeatable, testable process. It also removes a surprising amount of emotional decision-making from the early research stage — you’re not chasing a stock because it was mentioned somewhere, you’re evaluating it because it passed criteria you set in advance, with a clear head, before any position was on the line.
If you want a closer walkthrough of how screener interfaces and filters actually work in practice, see our dedicated guide on stock screening and analysis tools for beginners, which covers filter types, screener layouts, and how to read the results table without getting overwhelmed.
A stock screener is a filtering tool, not a strategy on its own. The value comes entirely from the criteria you choose and how consistently you apply them — the tool just executes the search faster and more accurately than manual scanning ever could.
How Stock Screeners Actually Work
Underneath the interface, a screener is essentially a live, filterable database. Every listed company has a row of data points — price, volume, sector, dozens of fundamental ratios, and sometimes technical indicators — updated at set intervals throughout the trading day. When you set a filter, such as “P/E under 20,” the screener simply removes every row where that condition is false, and shows you what remains. The power comes from stacking conditions together. A single filter might return hundreds of results; five well-chosen filters stacked together might return a dozen. That’s the entire mechanism — no forecasting, no prediction, just structured filtering applied consistently and instantly across an entire market.
Most screeners fall into a few broad categories, and understanding which type you’re using changes how you should build filters:
Fundamental Screeners
Filter by financial statement data — earnings, revenue growth, margins, debt levels, and valuation ratios. Best for longer-term research.
Technical Screeners
Filter by price action — moving averages, relative strength, breakout patterns, and volume spikes. Best for shorter-term timing.
Hybrid Screeners
Combine fundamental and technical filters in one pass, letting you find financially sound companies that are also showing price strength.
Event-Based Screeners
Filter by catalysts — earnings surprises, insider buying, upgrades, or unusual options activity — rather than static financial ratios.
Building a Screening Strategy for Beginners
If you’re new to screening, resist the urge to start with a dozen filters at once. A cluttered screen with too many overlapping conditions often returns zero results — or worse, a handful of stocks that only technically pass the criteria while missing the spirit of what you were trying to find.
Start with Basic Filters
Begin with three to five broad filters that reflect what you actually care about, and nothing more:
- Market capitalization — sets the size and stability band you’re comfortable with. Large caps tend to move more predictably; small caps move faster but carry more risk.
- Average daily volume — filters out illiquid stocks that are hard to enter or exit cleanly without moving the price against yourself.
- Price range — keeps results within your account size and position-sizing plan, so you’re not screening for stocks you can’t reasonably size a position in.
- Sector or industry — narrows results to areas you understand well enough to research further, rather than a random cross-section of the whole market.
- Basic valuation, like P/E ratio — gives an early read on whether a stock is priced reasonably relative to its earnings, though it should never be the only filter used.
Once you have a small, manageable list — usually under 30 names — the real work begins. This is where you move from screener output to actual research: reading recent earnings releases, checking news, and comparing the company against close competitors. A screener’s job ends the moment it hands you a shortlist; everything after that is judgment.
A Simple First Screen You Can Build Today
A workable starting point for most beginner investors looks something like this: market cap above a chosen floor, average daily volume above a liquidity threshold, P/E ratio within a reasonable band for the sector, and positive earnings over the trailing twelve months. That’s four filters, each doing one clear job, and together they eliminate the riskiest, least liquid, and least established names without being so restrictive that nothing passes.
Screening by Investing Style
Not every trader is looking for the same thing, and a screen built for one style will usually perform poorly for another. It helps to decide which style you’re screening for before you open the filter panel.
Value-Oriented Screening
Value screens typically prioritize low valuation multiples — P/E, price-to-book, and price-to-sales — alongside a stable or improving balance sheet. The goal is finding companies the market may be underpricing relative to their underlying business. The risk with pure value screening is picking up “value traps”: stocks that look cheap because the business is genuinely deteriorating, not because it’s misunderstood. Pairing valuation filters with a basic quality filter, such as positive free cash flow, helps reduce that risk.
Growth-Oriented Screening
Growth screens weight revenue and earnings growth rates heavily, often accepting higher valuation multiples in exchange for faster expansion. Filters here commonly include year-over-year revenue growth thresholds, expanding margins, and sometimes forward earnings estimates. The trade-off is that growth screens are more sensitive to broad market sentiment — growth-oriented names tend to move more sharply in both directions when conditions shift.
Income-Oriented Screening
Income screens center on dividend yield, payout ratio, and dividend growth history. A well-built income screen also filters for balance sheet strength, since a high yield paired with rising debt is often an early warning sign of a future dividend cut rather than a genuine opportunity.
Momentum and Technical Screening
Momentum screens look for stocks already trending, using filters like price relative to its moving averages, relative strength versus the broader market, or recent volume spikes. These screens tend to be run more frequently — sometimes daily — since the underlying condition (price momentum) changes quickly.
Advanced Screening Techniques for Professionals
Once the basics are second nature, more experienced traders and analysts typically move toward multi-factor, weighted screening — combining several categories of data rather than relying on any single ratio or style category in isolation.
Multi-Factor Screening
Instead of a single valuation metric, professional screens often blend value, quality, and momentum factors together. A stock might need to pass a valuation threshold and show improving margins and exhibit relative price strength versus its sector before it qualifies. This layered approach filters out value traps — cheap stocks that stay cheap because the underlying business is deteriorating — while also avoiding momentum names with no fundamental support underneath the move.
Combining Fundamental and Technical Filters
A common professional workflow runs fundamentals first, then technicals second: screen a universe down by earnings growth, debt levels, and profitability, then apply chart-based filters — such as moving average crossovers or relative strength — to the surviving list. This sequencing keeps the technical layer from surfacing fundamentally weak companies just because their chart looks appealing in the short term, and it keeps the fundamental layer from surfacing financially sound companies whose charts show no near-term catalyst.
Backtesting Screening Criteria
Professionals rarely deploy a new screen without first checking how it would have performed historically. Backtesting a screen means applying the same filter logic to past data and reviewing what it would have returned at various points in time — not to guarantee future results, but to catch obvious flaws, like a filter that’s so restrictive it would have returned nothing during most market conditions, or so loose it barely narrows anything at all.
Sector-Relative Screening
A P/E of 25 might be expensive for a utility company and cheap for a software company. Advanced screens frequently compare a stock’s metrics against its own sector average rather than using a single fixed threshold across the entire market. This keeps the screen relevant across very different types of businesses instead of accidentally filtering out an entire sector because its typical valuation range doesn’t match the rest of the market.
Avoiding Over-Optimization
It’s tempting to keep adding filters until a screen returns exactly the stocks you already had in mind. This is a trap. A screen that’s been tuned to match a handful of known winners in hindsight is unlikely to find new winners going forward — it’s simply been reverse-engineered to describe the past. The more useful test of a screen is whether it consistently returns a reasonable, varied list across different market conditions, not whether it perfectly matches one favorite stock.
Screening narrows the field. It doesn’t replace due diligence — it just makes due diligence more efficient by pointing it at the right candidates first.
Essential Metrics to Screen By
Whichever level you’re screening at, a handful of metrics tend to do most of the work. We cover these in full detail — including how each one is calculated and where it can mislead you — in our breakdown of the best metrics for evaluating stocks (P/E, EPS, ROE explained). As a quick reference:
| Metric | What It Measures | Best Used For |
|---|---|---|
| P/E Ratio | Price relative to earnings | Comparing valuation within a sector |
| EPS Growth | Rate of earnings growth over time | Spotting improving or declining profitability |
| ROE | Return generated on shareholder equity | Judging management efficiency |
| Debt-to-Equity | Leverage relative to equity base | Assessing financial risk |
| Free Cash Flow | Cash generated after operating and capital costs | Confirming earnings are backed by real cash |
| Relative Volume | Current volume vs. average | Confirming liquidity and interest |
| Dividend Payout Ratio | Share of earnings paid out as dividends | Judging dividend sustainability |
No single metric on this list should be used in isolation. P/E without a growth context can mislabel a fast-growing company as “expensive.” ROE without a debt check can flag a heavily leveraged company as “efficient” when it’s really just carrying more risk. The strongest screens use two or three of these together, each one checking the blind spot of the others.
Mistakes That Quietly Break a Screen
New and experienced screeners alike tend to make a similar handful of errors, often without realizing it until results stop making sense.
Treating the Screener as a Buy List
A screener tells you what fits your criteria — it never tells you what to do next. That step still requires reading financial statements, checking recent news, and confirming the setup fits your broader plan. Buying straight off a screener’s output, without further research, is one of the fastest ways to end up holding a stock you don’t actually understand.
Ignoring Liquidity
It’s easy to build a screen entirely around valuation or growth metrics and forget volume filters altogether. A stock might look perfect on paper and still be difficult to trade cleanly if daily volume is too thin, leading to wider spreads and worse fill prices than the numbers on screen would suggest.
Filters That Contradict Each Other
Combining a very low P/E filter with a very high growth filter, for example, often returns almost nothing — because businesses growing quickly are rarely priced at deep-value multiples. When a screen consistently returns zero or near-zero results, it’s usually a sign that two of the filters are working against each other rather than that the market has nothing to offer.
Rebuilding the Screen Every Day
Constantly tweaking filters based on yesterday’s results turns screening into guesswork rather than a repeatable process. It’s generally more useful to build a small number of stable, well-reasoned screens and run them on a consistent schedule than to redesign the criteria every session chasing whatever moved recently.
Building Your Own Screening Checklist
A durable screening process is one you can repeat without second-guessing every input. A simple structure that works for most traders, regardless of experience level:
- Set two or three non-negotiable filters (liquidity and market cap are common starting points for almost every strategy).
- Add one valuation filter appropriate to your strategy (value, growth, or income).
- Layer in a quality check, such as debt levels, free cash flow, or margin trend.
- Finish with a technical confirmation filter if your strategy is timing-sensitive.
- Save the screen and re-run it on a fixed schedule rather than constantly tweaking it.
- Keep a short log of what the screen returned each time you run it, so you can spot whether it’s staying useful over time.
For further context on how these criteria fit into a broader research process, the U.S. Securities and Exchange Commission’s Investor.gov guide to how stock markets work is a solid neutral reference point, and Investopedia’s overview of stock screeners is useful if you want a deeper definitional grounding before building your own filters.
Frequently Asked Questions
How many filters should a beginner use in a first screen?
Three to five is usually enough. More than that tends to either return zero results or filters that quietly contradict one another.
Can a stock screener replace fundamental research?
No. A screener narrows the field to a shortlist. Reading financial statements, recent news, and comparing competitors still has to happen after the screen runs.
How often should a screen be re-run?
It depends on the strategy. Long-term value or income screens are often fine weekly or monthly, while momentum or technical screens are commonly re-run daily since price conditions change quickly.
Should beginners combine fundamental and technical filters right away?
It’s usually better to master one category first. Once basic fundamental or technical filters feel comfortable, combining both in a single hybrid screen becomes far easier to interpret correctly.
Final Thoughts
Stock screening is less about finding a perfect combination of filters and more about building a process you trust and can repeat. Beginners benefit from starting simple and layering complexity slowly; professionals benefit from combining multiple factor types so no single metric can mislead the result. Either way, the screener’s job is to hand you a shorter, more relevant list — the research that follows is still yours to do.