Understanding Price Action in Trading (Simple Breakdown) | UCharts
:root {
–bg: #0d1117;
–surface: #161b22;
–surface2: #1e2631;
–border: #2a3340;
–accent: #00c896;
–accent2: #0ea5e9;
–red: #f87171;
–text: #e6edf3;
–muted: #8b949e;
–heading: #ffffff;
–radius: 10px;
–max: 780px;
}
*, *::before, *::after { box-sizing: border-box; margin: 0; padding: 0; }
body {
background: var(–bg);
color: var(–text);
font-family: ‘Inter’, sans-serif;
font-size: 16px;
line-height: 1.75;
-webkit-font-smoothing: antialiased;
}
/* ── ARTICLE WRAPPER ── */
.article-wrap {
max-width: var(–max);
margin: 0 auto;
padding: 48px 20px 80px;
}
/* ── BREADCRUMB ── */
.breadcrumb {
font-size: 0.78rem;
color: var(–muted);
margin-bottom: 18px;
}
.breadcrumb a { color: var(–accent); text-decoration: none; }
.breadcrumb a:hover { text-decoration: underline; }
/* ── CATEGORY TAG ── */
.category-tag {
display: inline-block;
background: rgba(0,200,150,.12);
color: var(–accent);
font-size: 0.72rem;
font-weight: 600;
letter-spacing: .08em;
text-transform: uppercase;
padding: 4px 10px;
border-radius: 20px;
margin-bottom: 20px;
border: 1px solid rgba(0,200,150,.25);
}
/* ── HEADINGS ── */
h1 {
font-family: ‘Space Grotesk’, sans-serif;
font-size: clamp(1.75rem, 4vw, 2.5rem);
font-weight: 700;
color: var(–heading);
line-height: 1.2;
letter-spacing: -0.5px;
margin-bottom: 20px;
}
h1 span { color: var(–accent); }
h2 {
font-family: ‘Space Grotesk’, sans-serif;
font-size: 1.45rem;
font-weight: 700;
color: var(–heading);
margin: 48px 0 16px;
letter-spacing: -0.3px;
display: flex;
align-items: center;
gap: 10px;
}
h2 .h2-icon {
width: 32px; height: 32px;
background: rgba(0,200,150,.12);
border-radius: 8px;
display: flex;
align-items: center;
justify-content: center;
font-size: 1rem;
flex-shrink: 0;
}
h3 {
font-family: ‘Space Grotesk’, sans-serif;
font-size: 1.1rem;
font-weight: 600;
color: var(–heading);
margin: 28px 0 10px;
}
p { margin-bottom: 16px; color: var(–text); }
strong { color: var(–heading); font-weight: 600; }
/* ── META ── */
.meta {
display: flex;
align-items: center;
gap: 16px;
color: var(–muted);
font-size: 0.82rem;
margin-bottom: 28px;
flex-wrap: wrap;
}
.meta-dot { width: 3px; height: 3px; border-radius: 50%; background: var(–border); }
/* ── HERO INTRO ── */
.hero-intro {
font-size: 1.05rem;
color: var(–muted);
line-height: 1.75;
border-left: 3px solid var(–accent);
padding-left: 16px;
margin-bottom: 40px;
}
/* ── DIVIDER ── */
.divider {
border: none;
height: 1px;
background: var(–border);
margin: 48px 0;
}
/* ── TOC ── */
.toc {
background: var(–surface);
border: 1px solid var(–border);
border-radius: var(–radius);
padding: 20px 24px;
margin: 32px 0 40px;
}
.toc-title {
font-size: 0.78rem;
font-weight: 700;
letter-spacing: .1em;
text-transform: uppercase;
color: var(–muted);
margin-bottom: 14px;
}
.toc ol {
list-style: none;
counter-reset: toc;
display: flex;
flex-direction: column;
gap: 8px;
}
.toc ol li {
counter-increment: toc;
display: flex;
align-items: center;
gap: 10px;
}
.toc ol li::before {
content: counter(toc, decimal-leading-zero);
font-size: 0.72rem;
font-weight: 700;
color: var(–accent);
font-family: monospace;
flex-shrink: 0;
}
.toc ol li a {
color: var(–muted);
text-decoration: none;
font-size: 0.88rem;
transition: color .15s;
}
.toc ol li a:hover { color: var(–text); }
/* ── TAKEAWAY BOX ── */
.takeaway {
background: rgba(0,200,150,.07);
border: 1px solid rgba(0,200,150,.22);
border-radius: var(–radius);
padding: 22px 24px;
margin: 36px 0;
}
.takeaway-label {
font-size: 0.72rem;
font-weight: 700;
letter-spacing: .1em;
text-transform: uppercase;
color: var(–accent);
margin-bottom: 10px;
}
.takeaway ul { list-style: none; display: flex; flex-direction: column; gap: 8px; }
.takeaway ul li {
display: flex;
align-items: flex-start;
gap: 10px;
font-size: 0.92rem;
color: var(–text);
}
.takeaway ul li::before {
content: ‘✓’;
color: var(–accent);
font-weight: 700;
flex-shrink: 0;
margin-top: 1px;
}
/* ── CONCEPT GRID ── */
.concept-grid {
display: grid;
grid-template-columns: 1fr 1fr;
gap: 14px;
margin: 24px 0 32px;
}
@media (max-width: 560px) { .concept-grid { grid-template-columns: 1fr; } }
.concept-card {
background: var(–surface);
border: 1px solid var(–border);
border-radius: var(–radius);
padding: 18px;
transition: border-color .2s, transform .2s;
}
.concept-card:hover { border-color: var(–accent); transform: translateY(-2px); }
.concept-card .card-icon { font-size: 1.4rem; margin-bottom: 8px; }
.concept-card h3 { font-size: 0.95rem; margin: 0 0 6px; color: var(–heading); }
.concept-card p { font-size: 0.85rem; color: var(–muted); margin: 0; line-height: 1.55; }
/* ── CANDLE DEMO ── */
.candle-demo {
background: var(–surface);
border: 1px solid var(–border);
border-radius: var(–radius);
padding: 28px 24px;
margin: 28px 0;
display: flex;
gap: 40px;
align-items: center;
flex-wrap: wrap;
}
.candle-visual { display: flex; gap: 24px; align-items: flex-end; flex-shrink: 0; }
.candle-item { display: flex; flex-direction: column; align-items: center; gap: 4px; }
.candle-label { font-size: 0.75rem; color: var(–muted); font-weight: 500; }
.wick { width: 2px; border-radius: 1px; }
.cbody { width: 16px; border-radius: 3px; }
.candle-info h3 { margin: 0 0 8px; font-size: 1rem; }
.candle-info p { font-size: 0.875rem; color: var(–muted); margin: 0; }
/* ── PATTERN ROWS ── */
.pattern-row { display: flex; flex-direction: column; gap: 12px; margin: 20px 0 32px; }
.pattern-item {
background: var(–surface);
border: 1px solid var(–border);
border-radius: var(–radius);
padding: 14px 18px;
display: flex;
align-items: center;
gap: 14px;
}
.pattern-badge {
width: 40px; height: 40px;
border-radius: 8px;
display: flex; align-items: center; justify-content: center;
font-size: 1.1rem; flex-shrink: 0;
}
.bullish .pattern-badge { background: rgba(0,200,150,.15); }
.bearish .pattern-badge { background: rgba(248,113,113,.12); }
.neutral .pattern-badge { background: rgba(14,165,233,.12); }
.pattern-text h4 { font-size: 0.92rem; color: var(–heading); font-weight: 600; margin-bottom: 2px; }
.pattern-text p { font-size: 0.82rem; color: var(–muted); margin: 0; }
.signal-tag {
margin-left: auto;
font-size: 0.7rem; font-weight: 700;
letter-spacing: .07em; text-transform: uppercase;
padding: 3px 9px; border-radius: 20px; flex-shrink: 0;
}
.bullish .signal-tag { background: rgba(0,200,150,.15); color: var(–accent); }
.bearish .signal-tag { background: rgba(248,113,113,.12); color: var(–red); }
.neutral .signal-tag { background: rgba(14,165,233,.1); color: var(–accent2); }
/* ── S/R VISUAL ── */
.sr-visual {
background: var(–surface);
border: 1px solid var(–border);
border-radius: var(–radius);
padding: 24px;
margin: 24px 0;
overflow: hidden;
}
/* ── CALLOUT ── */
.callout {
border-radius: var(–radius);
padding: 18px 20px;
margin: 28px 0;
display: flex; gap: 14px; align-items: flex-start;
}
.callout.tip { background: rgba(14,165,233,.08); border: 1px solid rgba(14,165,233,.2); }
.callout.warn { background: rgba(248,113,113,.07); border: 1px solid rgba(248,113,113,.18); }
.callout-icon { font-size: 1.1rem; flex-shrink: 0; margin-top: 1px; }
.callout-text p { font-size: 0.9rem; margin: 0; color: var(–text); }
/* ── STEP LIST ── */
.step-list { display: flex; flex-direction: column; gap: 16px; margin: 20px 0 32px; }
.step { display: flex; gap: 16px; align-items: flex-start; }
.step-num {
width: 32px; height: 32px; border-radius: 50%;
background: var(–accent); color: #000;
font-weight: 700; font-size: 0.85rem;
display: flex; align-items: center; justify-content: center;
flex-shrink: 0; margin-top: 2px;
}
.step-body h4 { font-size: 0.95rem; font-weight: 600; color: var(–heading); margin-bottom: 4px; }
.step-body p { font-size: 0.875rem; color: var(–muted); margin: 0; }
/* ── INTERNAL LINK CARD ── */
.internal-link-card {
background: linear-gradient(135deg, var(–surface) 0%, var(–surface2) 100%);
border: 1px solid var(–border);
border-left: 3px solid var(–accent2);
border-radius: var(–radius);
padding: 18px 20px;
margin: 28px 0;
display: flex; align-items: center; gap: 14px;
text-decoration: none;
transition: border-color .2s, transform .2s;
}
.internal-link-card:hover { border-left-color: var(–accent); transform: translateX(3px); }
.link-card-icon { font-size: 1.4rem; flex-shrink: 0; }
.link-card-text .label {
font-size: 0.7rem; font-weight: 700;
letter-spacing: .08em; text-transform: uppercase;
color: var(–accent2); margin-bottom: 3px;
}
.link-card-text .title { font-size: 0.95rem; font-weight: 600; color: var(–heading); }
.link-card-text .desc { font-size: 0.8rem; color: var(–muted); margin-top: 2px; }
.link-card-arrow { margin-left: auto; color: var(–muted); font-size: 1.1rem; flex-shrink: 0; }
/* ── COMPARE TABLE ── */
.compare-table {
width: 100%; border-collapse: collapse;
margin: 24px 0 32px; font-size: 0.875rem;
}
.compare-table th {
background: var(–surface2); color: var(–heading);
font-weight: 600; padding: 12px 16px;
text-align: left; border-bottom: 1px solid var(–border);
}
.compare-table td {
padding: 12px 16px; border-bottom: 1px solid var(–border);
color: var(–muted); vertical-align: top;
}
.compare-table tr:last-child td { border-bottom: none; }
.compare-table tr:hover td { background: rgba(255,255,255,.02); }
.compare-table td:first-child { color: var(–text); font-weight: 500; }
.yes { color: var(–accent); font-weight: 600; }
.no { color: var(–red); font-weight: 600; }
/* ── FAQ ── */
.faq { display: flex; flex-direction: column; gap: 12px; margin: 20px 0; }
.faq-item {
background: var(–surface);
border: 1px solid var(–border);
border-radius: var(–radius);
overflow: hidden;
}
details summary {
padding: 16px 18px;
font-weight: 600; color: var(–heading);
cursor: pointer; font-size: 0.95rem;
list-style: none;
display: flex; align-items: center; justify-content: space-between;
}
details summary::-webkit-details-marker { display: none; }
details summary::after { content: ‘+’; color: var(–accent); font-size: 1.2rem; font-weight: 300; }
details[open] summary::after { content: ‘−’; }
details .faq-body { padding: 0 18px 16px; font-size: 0.88rem; color: var(–muted); line-height: 1.7; }
/* ── CTA ── */
.cta-banner {
background: linear-gradient(135deg, rgba(0,200,150,.12) 0%, rgba(14,165,233,.1) 100%);
border: 1px solid rgba(0,200,150,.25);
border-radius: 14px;
padding: 36px 32px;
text-align: center;
margin: 48px 0 0;
}
.cta-banner h3 {
font-family: ‘Space Grotesk’, sans-serif;
font-size: 1.4rem; color: var(–heading); margin-bottom: 10px;
}
.cta-banner p { color: var(–muted); font-size: 0.92rem; margin-bottom: 24px; }
.cta-btn {
display: inline-block;
background: var(–accent); color: #000;
font-weight: 700; font-size: 0.9rem;
padding: 12px 28px; border-radius: 8px;
text-decoration: none;
transition: opacity .2s, transform .2s;
}
.cta-btn:hover { opacity: .88; transform: translateY(-1px); }
Home ›
Stocks ›
Understanding Price Action
📊 Trading Education
Understanding Price Action in Trading (Simple Breakdown)
By UCharts Team
June 27, 2026
⏱ 8 min read
Most traders drown in indicators — RSI, MACD, Bollinger Bands — and still lose money. Price action trading strips all of that away and focuses on the one thing that actually matters: what the price itself is doing. This guide breaks it all down simply, so you can start reading charts like a trader, not a spectator.
💡 What Is Price Action?
Price action is the study of how an asset’s price moves over time — without relying on lagging indicators. It reads the raw data of the market: every candlestick, every high, every low, every moment buyers and sellers clash.
At its core, price action answers three questions every trader needs answered before entering a trade:
The 3 Core Questions
- Where is the market right now — in a trend, range, or reversal?
- Where are the key price levels buyers and sellers are likely to react?
- What is the market “telling” me in this specific candlestick or pattern?
Price action is used across all markets — stocks, forex, crypto, commodities. The principles remain the same because human psychology drives price, and human psychology doesn’t change regardless of what you’re trading.
📈
Raw Chart Data
Price action uses only the open, high, low, and close (OHLC) of each bar — no extra calculation needed.
🧠
Psychology-Based
Every candle reflects the collective decisions of thousands of traders — fear, greed, uncertainty — all encoded in price.
⚡
Real-Time Signals
Price action reacts to the market instantly. Indicators lag because they calculate from past prices.
🌐
Universal Application
Works on any timeframe and any market — from 1-minute scalping to weekly swing trades.
🕯️ Reading Candlesticks
Candlesticks are the language of price action. Each candle tells a complete story about who was in control during that time period — buyers or sellers — and by how much.
What each part means
Body: The distance between open and close. Large body = strong conviction.
Wicks (Shadows): Price traveled here but got rejected. Long wicks = reversal pressure.
Doji: Open and close nearly equal. Market is undecided — watch the next candle.
Key Single-Candle Signals
You don’t need dozens of patterns. These four appear constantly and carry real weight:
🔨
Hammer
Small body at top, long lower wick. Buyers rejected lower prices — potential bottom signal.
Bullish
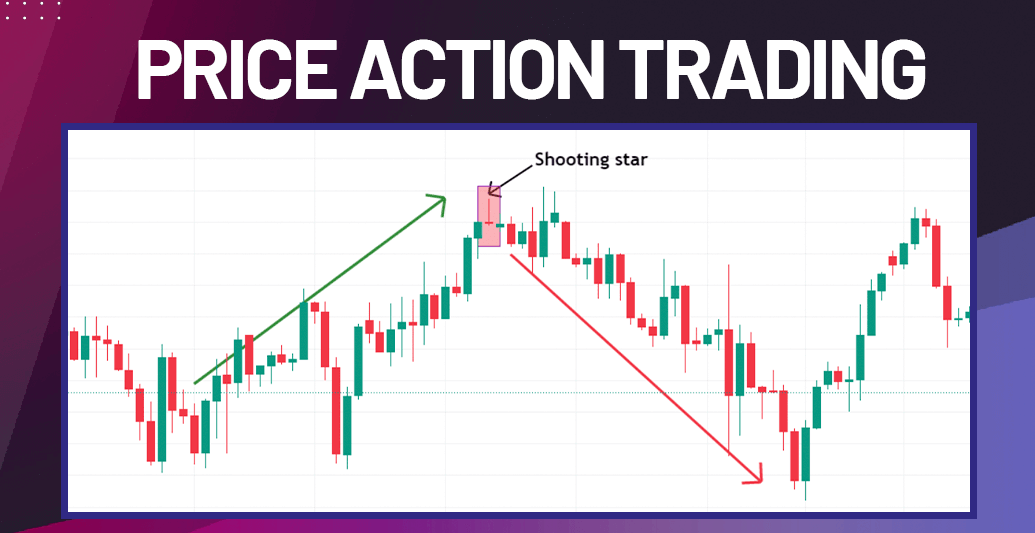
⭐
Shooting Star
Small body at bottom, long upper wick. Sellers pushed back from the highs — potential top signal.
Bearish
🟢
Bullish Engulfing
A large green candle fully covers the previous red candle. Strong momentum shift from bears to bulls.
Bullish
➖
Inside Bar
Entire candle fits within the previous candle’s range. Market consolidating — breakout incoming.
Neutral
💡
Pro Tip: Never trade a candle pattern in isolation. A hammer at a key support level is high-probability. A hammer in the middle of nowhere? Much weaker. Context is everything in price action.
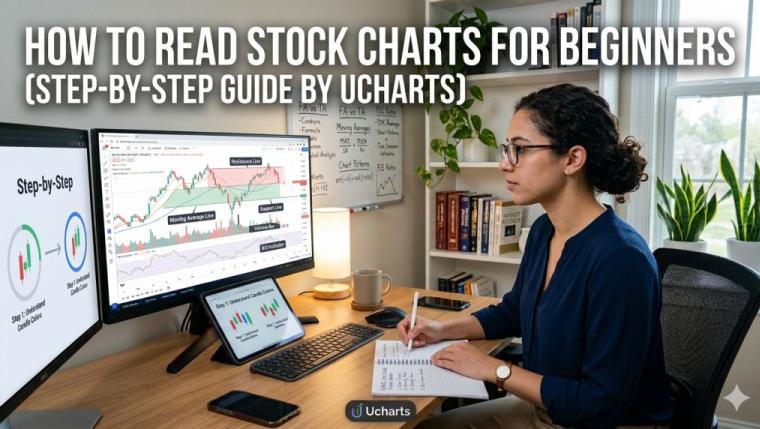
📖
Related Guide on UCharts
How to Read Stock Charts for Beginners (Step-by-Step)
Master the basics of chart reading before diving deeper into price action setups.
→
🧱 Support & Resistance Levels
Support and resistance are the foundation of price action trading. They are price zones where the market has historically reversed or stalled — and where it’s likely to react again in the future.
Support is a price floor where buying pressure stops the decline. Resistance is a ceiling where selling pressure overwhelms buyers.
Resistance
Support
↓
↓
↑
Price bounces between key levels until a breakout occurs
How to Identify Strong Levels
1
Multiple Touches
The more times price bounced from a level, the stronger it is. Two touches = notable. Three+ = significant.
2
Sharp Reversals
Levels where price moved aggressively away (not drifted) indicate strong buyer or seller presence.
3
Role Reversal
When a broken resistance becomes support (or vice versa), it gains extra significance — traders on both sides remember it.
4
Round Numbers
$100, $50, $1,000 — psychological levels act as magnets because large orders cluster around them.
🔷 Key Chart Patterns
Price action patterns are formations that appear repeatedly across all markets. They represent collective decision-making at key moments.
📐
Inverted Head & Shoulders
Three lows with the middle being lowest. Classic bullish reversal — neckline break confirms the move.
Bullish Reversal
🏔️
Double Top
Price hits the same resistance twice and fails. Buyers are exhausted and sellers are taking control.
Bearish Reversal
📦
Rectangle / Range
Price moves sideways between support and resistance. Trade the range or wait for a confirmed breakout.
Continuation
📊
Bull Flag
A sharp move up followed by tight downward consolidation. Usually resolves upward — trend continuation.
Bullish Continuation
⚠️
Common Mistake: Traders often force patterns onto charts that aren’t really there. A pattern is only valid when it’s obvious — if you’re squinting and convincing yourself, skip the trade. Clean patterns on higher timeframes are far more reliable.
📉 Trend Structure & Market Flow
Price never moves in a straight line. It moves in waves — impulse moves followed by corrections. Understanding this is what separates traders who catch trends from those who fight them.
📈
Uptrend
Higher highs (HH) and higher lows (HL). Each pullback finds buyers at higher prices. Buy pullbacks to HL zones.
📉
Downtrend
Lower highs (LH) and lower lows (LL). Each rally finds sellers at lower prices. Sell rallies into LH zones.
↔️
Ranging Market
No directional bias — price oscillates between support and resistance. Trade the range or wait for breakout.
🔄
Trend Change Signal
A trend change begins when price breaks previous swing structure — e.g. an uptrend breaks its last HL.
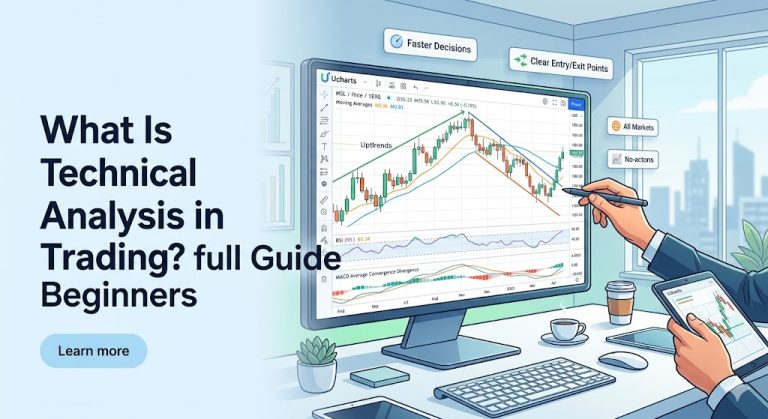
🔬
Deep Dive on UCharts
What Is Technical Analysis in Trading? Full Guide for Beginners
Understand how price action fits within the broader framework of technical analysis.
→
⚖️ Price Action vs Indicators
Both approaches work — but understanding the difference helps you decide when to use each.
| Factor |
Price Action |
Indicators (RSI, MACD, etc.) |
| Signal Speed |
Real-time |
Lagging (calculated from past price) |
| Chart Clarity |
Clean, minimal |
Can become cluttered with multiple indicators |
| Learning Curve |
Moderate — requires chart reading experience |
Low initially, but interpretation gets complex |
| Subjectivity |
Higher — two traders may read same chart differently |
Lower — math gives objective numbers |
| Best Use |
Entry timing, reading sentiment |
Trend confirmation, overbought/oversold screening |
The best traders use a combination: price action for entries and exits, and one or two indicators for confirmation — not prediction.
🚀 How to Start Using Price Action
Theory means nothing without practice. Here’s a simple, repeatable process to build your price action skills from scratch:
1
Start on Higher Timeframes
The daily and weekly charts are far cleaner than intraday charts. Identify major support, resistance, and trend direction here first.
2
Draw Only the Most Obvious Levels
Overmarked charts create confusion. Mark only two or three key levels — the ones price has strongly reacted to multiple times.
3
Wait for Price to Come to Your Level
Don’t chase price. Let it come to a marked level, then look for a confirmation candlestick — only enter after that confirmation.
4
Backtest on 50+ Historical Examples
Use UCharts or TradingView to scroll back and replay how patterns played out. Recognition is built through repetition, not theory.
5
Use the UCharts Risk Reward Calculator
Always define your stop loss and take profit before the trade. Know your risk before you risk it.
Simple Price Action Checklist
- Is there a clear trend or defined range on the higher timeframe?
- Am I entering near a key support or resistance level?
- Is there a confirming candlestick pattern at that level?
- Is my risk/reward at least 1:2 or better?
- Is this a high-quality setup, or am I forcing a trade?
❓ Frequently Asked Questions
Is price action better than using indicators?
Neither is universally better. Price action excels at timing and reading market sentiment in real time. Indicators confirm what price action already suggests. Many experienced traders use price action as their primary method and one indicator for context.
What timeframe is best for price action trading?
Price action works on every timeframe, but beginners should start on the daily chart. It filters out the noise of 5-minute or 15-minute charts and shows cleaner patterns without the stress of rapid movement.
How long does it take to learn price action?
With consistent practice — backtesting daily and forward-testing on a demo account — most traders develop solid pattern recognition within 3 to 6 months. Mastery takes years, but profitable competency is achievable much sooner.
Can price action be used for crypto and forex?
Yes. Price action principles work identically across stocks, forex, crypto, and commodities because all markets are driven by buyer and seller behavior. The patterns and levels apply universally.
What tool does UCharts recommend for charting?
UCharts is built for clean, real-time stock market analysis optimized for price action traders. You can also use TradingView alongside UCharts for multi-market access. Keep your chart clean — less clutter means clearer signals.
Analyze Markets with Clean, Real-Time Charts
UCharts gives you professional-grade charts without the clutter. Built for traders who read price action, not indicator overload.
Open UCharts App →