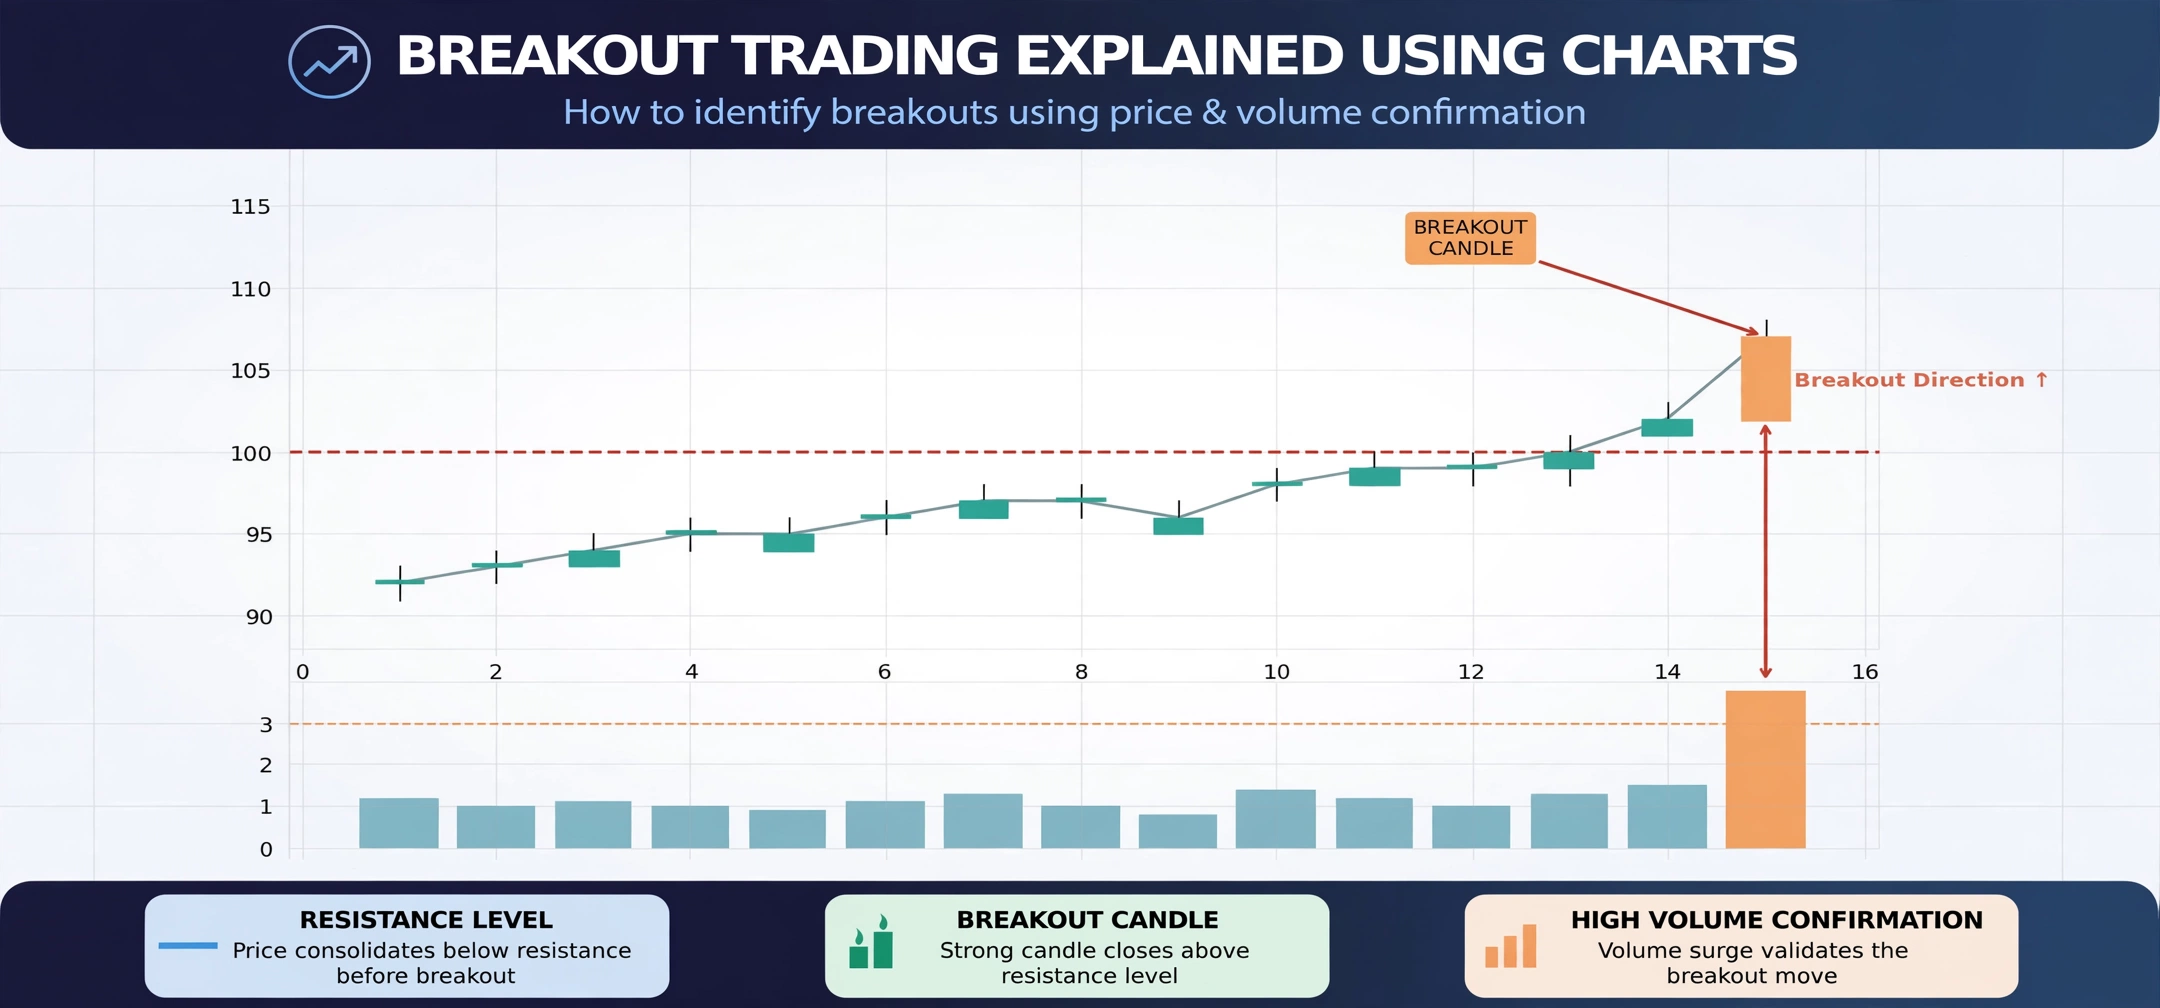
Breakout Trading Explained Using Charts
A clear guide to spotting genuine breakouts, avoiding false ones, and trading them using nothing more than a price chart.
Few moments on a chart feel as exciting as a genuine breakout — price coils up for days or weeks, then suddenly explodes out of its range with strong momentum. Breakout trading is one of the most popular strategies among both beginners and professionals because it’s visual, intuitive, and works across stocks, forex, and crypto alike. But it’s also one of the easiest strategies to get wrong, since not every breakout leads anywhere. This guide breaks down exactly what a breakout is, why it happens, and how to trade one using pure chart analysis.
What Is a Breakout in Trading?
A breakout occurs when price moves beyond a defined support or resistance level, a trendline, or the boundary of a chart pattern, with enough force to suggest the previous range is no longer holding. Instead of bouncing back inside the range like it may have done several times before, price pushes through and often keeps moving in that direction.
Breakouts matter because they usually mark the beginning of a new trend, or the resumption of an existing one after a pause. Traders who can identify a breakout early — and confirm it’s likely to be genuine — can position themselves at the very start of a potentially large price move.
Why Breakouts Happen
Price doesn’t move in a straight line forever. Markets naturally cycle between periods of expansion, where price moves strongly in one direction, and periods of contraction, where price consolidates sideways as buyers and sellers reach a temporary balance. A breakout is simply the moment that balance tips decisively in one direction.
This tipping point is often triggered by a news event, an earnings report, a shift in broader market sentiment, or simply the accumulation of enough buy or sell orders at a key level to finally overwhelm it. Whatever the trigger, the underlying pattern on the chart tends to look remarkably similar: a period of tightening price action followed by a sharp, decisive move.
Types of Breakouts
Continuation Breakout
This happens when price pauses briefly within an existing trend — often forming a flag, pennant, or small rectangle — before breaking out in the same direction as the original trend. Continuation breakouts tend to be some of the more statistically reliable setups, since they’re supported by existing momentum.
Reversal Breakout
A reversal breakout occurs when price breaks out of a long-standing range or pattern in the opposite direction of the prior trend, often signaling that a completely new trend is beginning. These breakouts can be highly profitable but generally require more confirmation before entering, since they go against the established direction.
Range Breakout
When a stock or currency pair trades sideways between a clear support and resistance level for an extended period, a range breakout happens when price finally pushes beyond one side of that range with conviction, often after multiple failed attempts.
Volatility Contraction Breakout
Sometimes price doesn’t just consolidate sideways — it actually contracts, with each swing getting smaller and smaller, often visible as a tightening triangle on the chart. This shrinking volatility frequently precedes a sharp expansion once the breakout finally occurs, since energy has been building up during the quiet period.
How to Spot a Breakout Setup Before It Happens
The best breakout trades are rarely a surprise if you know what to look for in advance. A few visual clues tend to appear on the chart before the actual breakout occurs:
- Tightening price range: Candles start forming smaller bodies and shorter wicks as the market consolidates.
- Repeated tests of the same level: Price approaches the same support or resistance zone multiple times without breaking it, building pressure.
- Declining volume during consolidation: Trading activity often quiets down right before a breakout, as participants wait for a clear signal.
- Recognizable chart patterns: Triangles, flags, rectangles, and wedges are classic visual signs that a breakout may be forming.
Confirming a Real Breakout vs a False Breakout
Not every push through a key level turns into a genuine breakout. Markets frequently produce false breakouts, where price briefly moves beyond a level before snapping back inside the range, often trapping traders who entered too early.
| Signal | Real Breakout | False Breakout |
|---|---|---|
| Volume | Noticeably above average as price breaks the level | Flat or below average, with little conviction behind the move |
| Candle close | Closes clearly beyond the level, not just wicks through it | Wicks through the level but closes back inside the range |
| Retest behavior | Price pulls back to the broken level and holds it as new support/resistance | Price pulls back and pushes straight through, back into the old range |
| Follow-through | Continues moving in the breakout direction over the following sessions | Stalls almost immediately or reverses within a candle or two |
How to Trade a Breakout Step by Step
- Identify the range or pattern. Mark the support, resistance, or pattern boundary that price needs to break for the setup to be valid.
- Wait for a decisive close beyond the level. Avoid reacting to a single wick poking through — look for the candle to close clearly outside the range.
- Check volume. Confirm that trading activity picked up noticeably during the breakout candle compared to the recent average.
- Consider waiting for a retest. If the broken level holds as new support or resistance on a pullback, that’s a strong confirmation signal.
- Enter with a defined stop-loss and target. Place your stop just beyond the opposite side of the broken level, and set a realistic target based on the size of the prior range or pattern.
Where to Place Stop-Loss and Take-Profit on a Breakout
A common approach is to place the stop-loss just beyond the opposite boundary of the pattern that broke — for example, slightly below the old support level after a bullish breakout. This gives the trade enough room to breathe while still protecting against the setup completely failing.
For take-profit targets, many traders measure the height of the pattern or range that just broke and project that same distance from the breakout point. A range that was $5 wide, for instance, might suggest an initial target roughly $5 beyond the breakout level, though this should always be adjusted based on nearby support or resistance zones further along the chart.
Best Chart Patterns That Lead to Breakouts
Certain recurring chart patterns are especially well known for producing breakouts, including ascending and descending triangles, symmetrical triangles, bull and bear flags, rectangles, and wedges. Learning to recognize these shapes early gives you a head start on anticipating where a breakout is likely to occur.
Combining these patterns with candlestick signals at the moment of the breakout adds another layer of confirmation. If you haven’t already, our guide on analyzing stocks using trading charts and indicators covers how to layer indicators and pattern recognition together for a more complete picture. Once you’ve spotted a breakout setup, it’s also worth double-checking your position size and pip risk with the Pips Calculator before entering, especially on forex pairs where pip value can vary significantly between instruments.
Best Timeframes for Breakout Trading
Breakouts can appear on any timeframe, but the reliability of the signal tends to scale with the timeframe used. A breakout on a daily or weekly chart, built from weeks of consolidation, generally carries far more significance than the same shape appearing on a 5-minute chart. Shorter timeframes produce breakouts far more frequently, but also with a much higher rate of failure.
A practical approach is to identify the consolidation pattern on a daily chart, then use a shorter timeframe such as the 1-hour or 4-hour chart to time the actual entry once the breakout candle closes.
Common Mistakes Breakout Traders Make
- Chasing every wick through a level: A brief poke beyond resistance isn’t the same as a confirmed breakout. Wait for a proper close.
- Ignoring volume entirely: Breakouts on weak volume fail far more often than those backed by a genuine surge in participation.
- Skipping the retest: Entering purely on the initial breakout candle, without waiting for confirmation, increases exposure to false breakouts.
- Setting targets too far away: Overly ambitious targets that ignore nearby resistance zones often go unfilled, even when the breakout direction is correct.
- Trading breakouts in choppy, low-volatility markets: Range-bound, low-volatility conditions produce a disproportionate number of false breakouts compared to trending markets.
For further reading on breakout theory and pattern recognition, resources such as Investopedia’s explanation of breakout trading and the technical analysis lessons published by the Corporate Finance Institute provide additional detail and historical chart examples worth reviewing.
Frequently Asked Questions
What’s the single best sign of a genuine breakout?
No single signal is perfect, but a strong close beyond the level combined with clearly above-average volume is one of the most reliable combinations. When both align, the odds of a genuine, sustained breakout increase significantly.
Why do false breakouts happen so often?
False breakouts frequently occur because large market participants intentionally trigger stop-losses and breakout orders clustered just beyond a well-known level, only to reverse price once those orders are filled. This is often referred to as a “stop hunt” or “liquidity grab.”
Is breakout trading suitable for beginners?
Yes, with the right expectations. Breakout trading is visually intuitive and easier to learn than many other strategies, but beginners should focus heavily on volume confirmation and retests before entering, rather than reacting to every level that gets touched.
Practicing Breakout Recognition
As with most chart-based skills, breakout trading improves with repeated exposure to real examples. Spend time scrolling through historical daily charts, marking consolidation zones before they broke out, and then reviewing what actually happened afterward — did the breakout hold, retest cleanly, or fail entirely? Building this visual library over time makes it far easier to recognize genuine setups forming in real time, rather than reacting emotionally to every sudden price spike.
Final Thoughts
Breakout trading captures some of the most powerful moves available on a price chart, but only when approached with proper confirmation. Learning to recognize consolidation patterns, waiting for volume-backed closes beyond key levels, and respecting the retest process can dramatically improve the reliability of your breakout trades compared to simply reacting to the first sign of movement.
Start by practicing pattern recognition on historical charts, apply strict confirmation rules before entering live trades, and always pair your breakout setups with clear stop-loss and target planning.