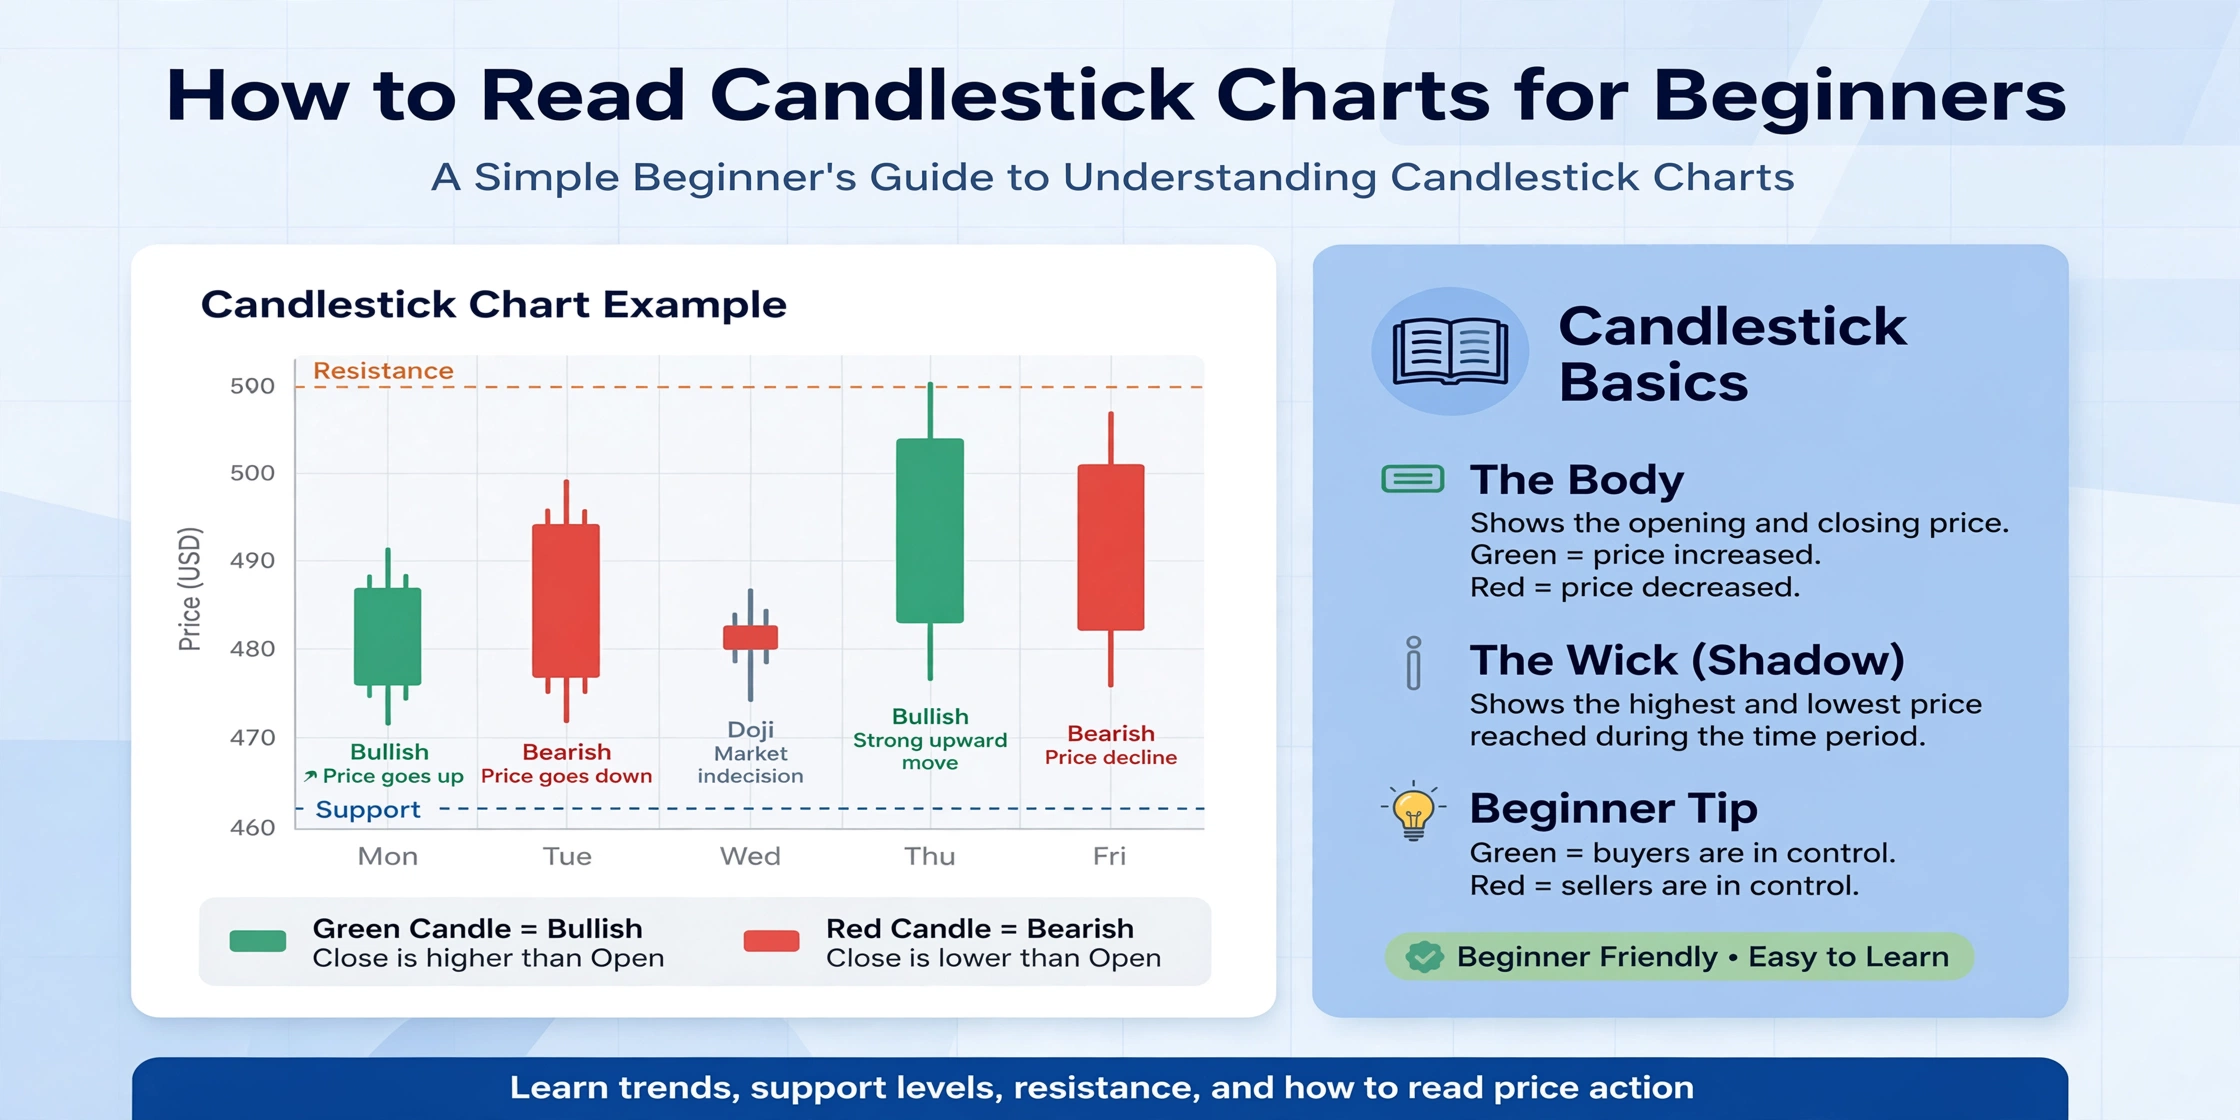
How to Read Candlestick Charts for Beginners
A practical, step-by-step guide to understanding candlestick bodies, wicks, colors, and the patterns that matter most.
If you have ever opened a trading app and seen a screen full of small red and green bars, you were looking at a candlestick chart. It looks intimidating at first, but once you understand the basic building blocks, candlestick charts become one of the fastest ways to read market sentiment at a glance. This guide breaks the concept down from scratch, so that even a complete beginner can start recognizing patterns with confidence.
Candlestick charts originated in 18th-century Japan, where rice traders used them to track price movement and market psychology long before modern computers existed. Today, they are the default chart type on almost every trading platform because they pack four pieces of price information — open, high, low, and close — into a single, easy-to-read shape.
What Is a Candlestick Chart?
A candlestick chart is a way of displaying the price movement of an asset — a stock, forex pair, or cryptocurrency — over a specific period of time. Each “candle” represents one time interval, which could be one minute, one hour, one day, or even one week, depending on the timeframe you select. When you line up dozens or hundreds of these candles side by side, you get a visual story of how buyers and sellers have been fighting for control of the price.
Unlike a simple line chart, which only shows the closing price, a candlestick shows the full range of price action within that period. This extra detail is exactly why most traders prefer candlesticks over line charts, especially when trying to spot early signs of a trend reversal or continuation.
The Anatomy of a Candlestick
Every single candlestick is made up of two main parts:
- The Body: The thick, rectangular part of the candle. It represents the distance between the opening price and the closing price for that period.
- The Wicks (or Shadows): The thin lines above and below the body. They show the highest and lowest prices reached during that period, even if the price didn’t stay there.
Understanding Bullish vs Bearish Candles
Candlestick colors instantly tell you which side won the battle between buyers and sellers during that period.
| Candle Type | Meaning | Typical Color |
|---|---|---|
| Bullish | Closing price is higher than the opening price — buyers were in control. | Green or white |
| Bearish | Closing price is lower than the opening price — sellers were in control. | Red or black |
Some platforms let you customize these colors, but green-for-up and red-for-down has become the near-universal standard, which makes it easy to switch between different charting tools without confusion.
Common Single Candlestick Patterns
Once you understand individual candles, the next step is recognizing patterns. A pattern is simply one or more candles arranged in a way that historically hints at what might happen next. Here are the single-candle patterns every beginner should learn first.
Doji
A Doji forms when the opening and closing prices are almost identical, creating a very small or non-existent body with wicks on either side. It signals indecision in the market — neither buyers nor sellers were able to gain a clear advantage. A Doji appearing after a strong trend can be an early warning that momentum is fading.
Hammer
A Hammer has a small body near the top of the candle with a long lower wick, roughly two or three times the length of the body. It typically appears at the bottom of a downtrend and suggests that sellers pushed price down, but buyers stepped in and pushed it back up before the close — a possible sign of a reversal.
Shooting Star
The mirror image of a Hammer, a Shooting Star has a small body near the bottom with a long upper wick. It usually appears at the top of an uptrend and suggests buyers tried to push price higher but were overpowered by sellers before the close.
Marubozu
A Marubozu has little to no wicks at all — just a full, solid body. A bullish Marubozu opens at the low and closes at the high, showing overwhelming buying pressure throughout the entire period. A bearish Marubozu does the opposite, showing dominant selling pressure.
Common Multi-Candle Patterns
While single candles offer quick clues, patterns formed by two or three candles together tend to carry more weight because they capture a shift in sentiment over time rather than a single snapshot.
Engulfing Pattern
A bullish engulfing pattern happens when a small bearish candle is immediately followed by a larger bullish candle that completely “engulfs” the previous candle’s body. It suggests that buyers have decisively taken over. The bearish engulfing pattern is the exact opposite and can signal an upcoming downtrend.
Morning Star and Evening Star
These are three-candle formations. A Morning Star appears at the bottom of a downtrend: a large bearish candle, followed by a small-bodied candle (showing indecision), followed by a large bullish candle. It’s considered one of the more reliable reversal signals. The Evening Star is its bearish counterpart, appearing at the top of an uptrend.
Harami
A Harami pattern occurs when a small candle forms completely inside the body of the previous, much larger candle. It suggests that momentum is slowing down and a reversal or pause may be coming.
Timeframes and Candlestick Charts
The same candlestick pattern can mean very different things depending on the timeframe you’re viewing. A Doji on a 1-minute chart might just be noise, while the same Doji on a weekly chart could represent a significant shift in long-term sentiment. Beginners are often advised to start by studying daily charts, since they filter out a lot of short-term “noise” caused by algorithmic trading and low-liquidity hours, before gradually moving to shorter timeframes as they gain experience.
It also helps to view a pattern across at least two timeframes before making any decisions — for example, confirming a daily reversal signal by checking whether the 4-hour chart shows a similar shift in structure.
Combining Candlestick Patterns With Other Tools
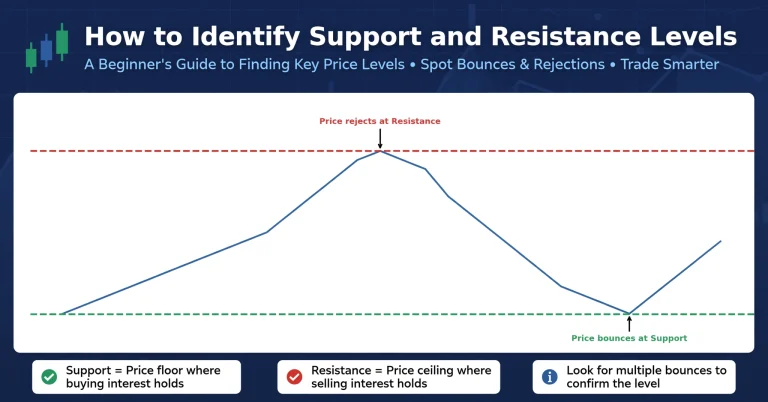
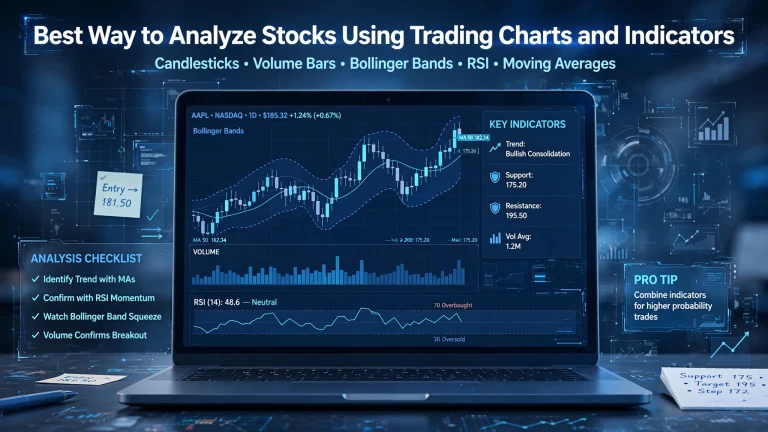
Candlestick patterns are useful, but they work best when combined with other forms of analysis rather than used in isolation. Relying on a single Hammer or Doji without any other context is one of the fastest ways for beginners to make costly mistakes. Instead, experienced traders usually confirm a candlestick signal using support and resistance levels, trend lines, volume, or technical indicators such as moving averages and the RSI.
If you want to go deeper into how indicators and charting tools work together, our guide on analyzing stocks using trading charts and indicators walks through the process step by step. It’s also worth understanding how chart-based analysis compares to fundamentals-driven research, which we cover in detail in Technical vs Fundamental Analysis Explained Clearly.
Common Mistakes Beginners Make
- Trading a pattern in isolation: A single candle rarely tells the whole story. Always look at the broader trend and nearby support/resistance zones.
- Ignoring the timeframe: The same shape can mean different things on a 5-minute chart versus a weekly chart.
- Forgetting about volume: A reversal pattern backed by high trading volume is generally more reliable than one formed during a quiet, low-volume session.
- Overtrading every pattern: Not every Doji or Hammer leads to a reversal. Patience and confirmation matter more than reacting to every candle.
- Skipping risk management: Even a textbook-perfect pattern can fail. Position sizing and stop-loss placement matter just as much as pattern recognition.
For a deeper, research-backed explanation of price action and chart theory, resources such as Investopedia’s guide to candlestick charting and the educational materials published by the CME Group’s education center are excellent places to reinforce these fundamentals with real market examples.
Practicing Candlestick Reading the Right Way
Reading candlestick charts is a skill that improves with repetition. Start by pulling up historical charts and, without looking ahead, try to predict what might happen next based on the pattern you see. Then check what actually happened. Over time, this simple exercise trains your eye to recognize patterns faster and more accurately than memorizing definitions alone.
It also helps to practice on a platform that lets you view real-time price data alongside clean, uncluttered candlestick charts. If you’re just starting out, our complete guide to the UCharts trading charting tool explains how to set up your charts, switch timeframes, and start spotting these patterns in a live market environment.
Frequently Asked Questions
Do candlestick patterns work on every asset class?
Yes, candlestick patterns apply to stocks, forex, commodities, and cryptocurrencies alike, since they are based on universal buyer-seller psychology rather than a specific asset. That said, highly volatile assets like crypto can produce more false signals, so extra confirmation is usually recommended.
How many candlestick patterns do I really need to memorize?
You don’t need to memorize dozens of obscure patterns to trade effectively. Most experienced traders rely on a core group of six to eight patterns — such as the Doji, Hammer, Shooting Star, and Engulfing patterns covered above — and focus on mastering how to confirm them rather than chasing every rare formation.
Can candlestick charts be used alone, without any indicators?
Some traders do use pure price-action strategies built entirely around candlestick behavior, support, and resistance. However, most beginners find it easier and safer to combine candlestick reading with at least one or two supporting indicators until their pattern-recognition instincts become more reliable.
Building a Simple Daily Habit
One of the fastest ways to internalize candlestick reading is to build a short daily review habit. Spend five to ten minutes each day scanning the charts of a few assets you follow closely, and simply name the patterns you can identify — even if you don’t act on them. Over a few weeks, this repetition trains your brain to recognize shapes almost instantly, the same way an experienced reader recognizes whole words instead of sounding out individual letters.
As your comfort level grows, try journaling each pattern you spot along with what actually happened afterward. This creates a personal reference library that is far more valuable than any generic pattern cheat sheet, because it reflects how these formations actually behave on the specific assets and timeframes you trade.
Final Thoughts
Candlestick charts turn raw price data into a visual language that traders around the world use every day. Once you understand the anatomy of a single candle — the body, the wicks, and what the colors mean — recognizing patterns like the Doji, Hammer, Engulfing, and Morning Star becomes much easier. Like any skill, it takes consistent practice, but the payoff is a much sharper sense of market sentiment and timing.
Start small: pick one or two patterns, study them on historical charts, and gradually build your pattern-recognition library from there.