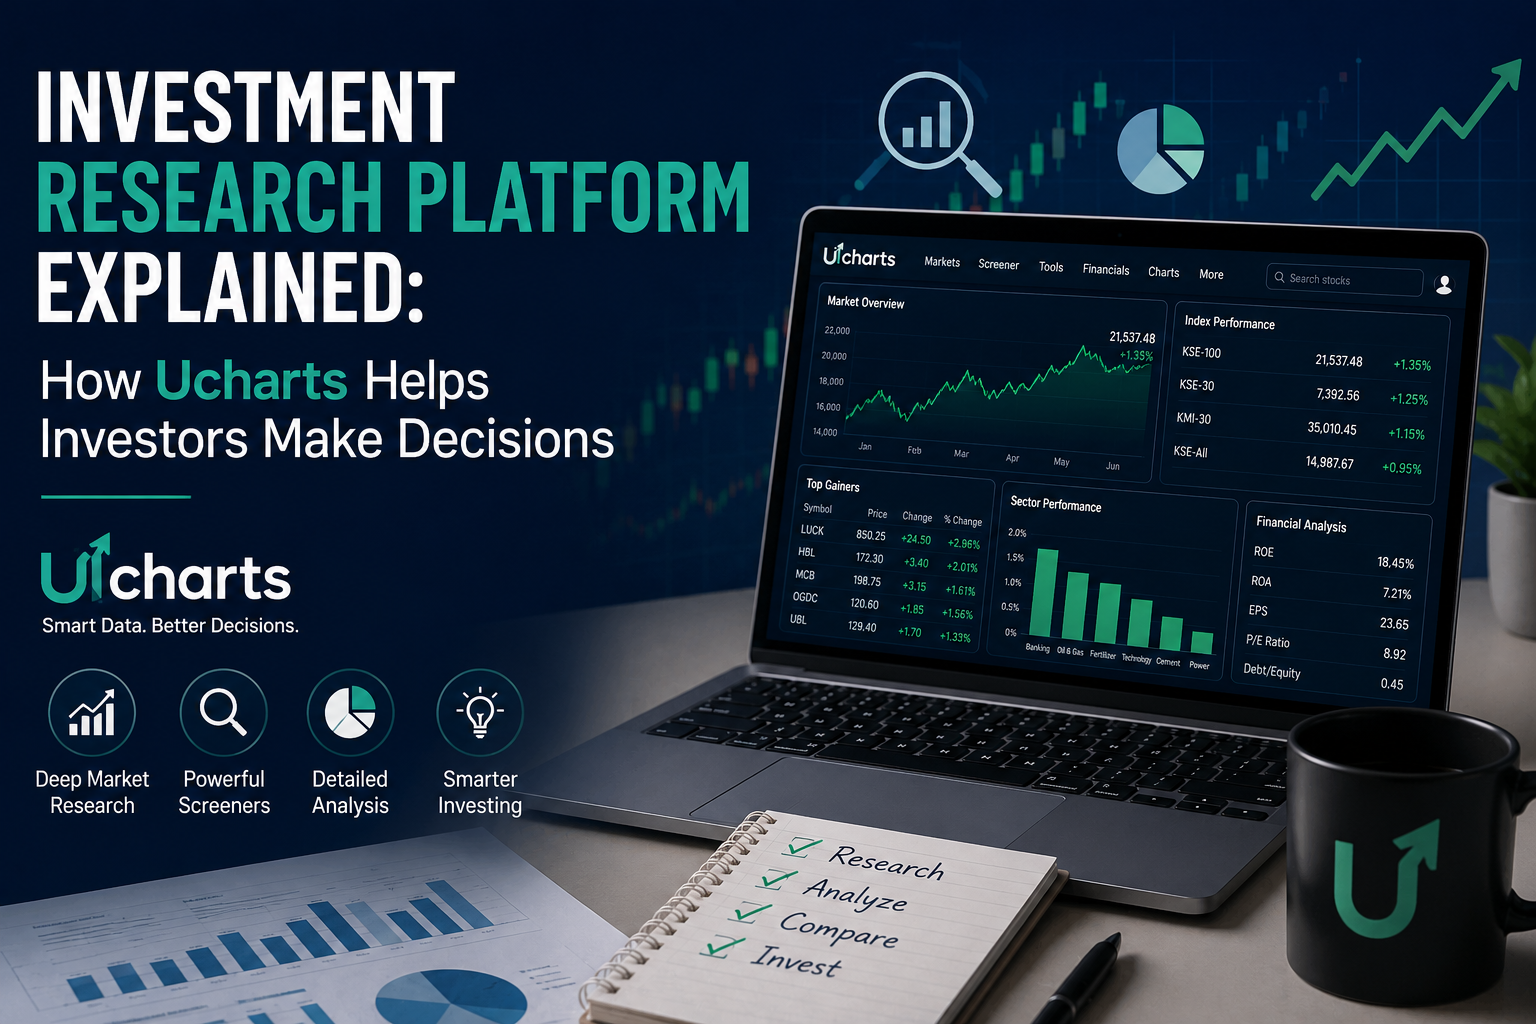
Investment Research Platform Explained: How Ucharts Helps Investors Make Decisions
Understanding what an investment research platform actually does — and how Ucharts brings charting, calculators, and market education together in one place.
Every investor eventually runs into the same problem: information is scattered across a dozen different tools. Price charts live in one app, risk calculators in a spreadsheet, and market news in a browser tab that gets buried under twenty others. An investment research platform exists to solve exactly this problem — bringing the tools an investor actually uses into a single, coherent workflow. This article explains what a research platform is, why it matters, and how Ucharts approaches this problem for everyday traders and investors.
The idea of a “research platform” can sound abstract until you break it down into the actual questions an investor asks before every trade: What is the price doing right now? How much should I risk? Is this setup even worth taking? A platform earns its usefulness by answering these questions quickly and consistently, rather than requiring a different tool — or a different login — for each one.
FoundationsWhat Is an Investment Research Platform?
An investment research platform is a tool, or a connected set of tools, that helps investors gather and interpret the information needed to evaluate a stock, forex pair, commodity, or cryptocurrency before committing capital. At minimum, this typically includes price charting, some form of technical analysis tools, and access to relevant market data.
The better platforms go a step further by adding practical decision-support tools — position sizing, risk-reward analysis, and educational content that helps investors interpret what they’re looking at, rather than just displaying numbers and leaving interpretation entirely up to the user.
It’s worth distinguishing a research platform from a brokerage. A brokerage exists to execute trades and hold assets; a research platform exists to inform the decision that happens before execution. Some brokerages bundle basic research tools into their apps, but these are often secondary to the trading function itself. A dedicated research platform, by contrast, is built around analysis and planning first, which tends to result in a more focused, less cluttered experience. This distinction matters because it shapes what the platform prioritizes in its design — clarity and decision support, rather than order execution speed.
Why Scattered Tools Slow Investors Down
When charting, calculating, and learning all happen in different places, investors lose time switching context, and worse, they lose consistency. A risk calculation done once in a spreadsheet is easy to forget to repeat on the next trade. A chart pattern studied last month is easy to misremember without a reference guide close at hand. Consolidating these functions reduces friction and makes good habits easier to repeat.
Platform OverviewHow Ucharts Approaches Investment Research
Ucharts is built around a simple idea: investors make better decisions when charting, risk management, and education sit in the same workflow instead of being spread across unrelated tools. Rather than trying to be everything for every type of trader, the platform focuses on the core steps most investors repeat for every position they consider.
Real-Time Charting
At the center of the platform is real-time chart data for widely tracked stock symbols, including S&P 500 companies. Clean, responsive charts that work across desktop and mobile browsers make it easier to review price action without needing a separate dedicated charting subscription.
Free Trade Planning Tools
Ucharts includes a built-in Trade Planner that lets investors enter an account size, risk percentage, entry price, stop-loss, and take-profit level to evaluate a potential trade before placing it. This single step replaces several manual calculations that are easy to skip when moving quickly.
Dedicated Calculators
Beyond the general trade planner, Ucharts offers focused calculators for specific parts of the research and risk process. These are useful when an investor wants a quick, isolated answer rather than a full trade workup.
- Position Size Calculator — determines how many shares or units to trade based on account size and risk tolerance.
- Risk Reward Calculator — evaluates whether a trade’s potential upside justifies its downside before entry.
- Pips Calculator — helps forex traders convert price movement into a clear monetary value.
WorkflowHow Investors Can Use Ucharts Step by Step
A research platform is only useful if it fits into a repeatable process. Here is a simple workflow that mirrors how the tools on Ucharts are designed to be used together.
The value of following the same sequence every time isn’t just convenience — it’s consistency. Investors who evaluate every trade through the same steps are far less likely to make impulsive decisions based on excitement or fear of missing out, because the process itself acts as a checkpoint before capital is committed.
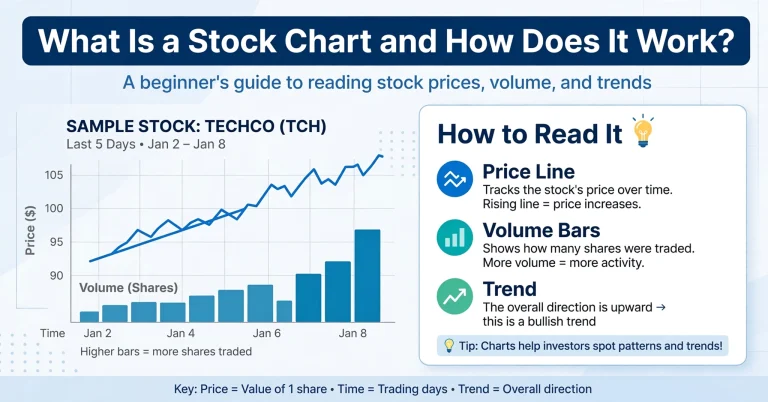
- Review the chart. Start by looking at recent price trend, volume, and any obvious support or resistance zones before forming an opinion on the trade.
- Identify a level-based plan. Decide on a realistic entry point, a stop-loss that protects against being wrong, and a take-profit target based on the chart structure.
- Run the numbers. Enter those levels into the Trade Planner or Risk Reward Calculator to see whether the setup is worth taking at all.
- Size the position. Use the Position Size Calculator to confirm how much capital to commit without exceeding a comfortable risk percentage.
- Revisit the education content. If any part of the chart or setup is unclear, review the relevant guide before finalizing the decision, rather than guessing.
EducationMarket Guides That Support the Tools
Calculators and charts are only as useful as an investor’s ability to interpret them correctly. This is why Ucharts pairs its tools with plain-language educational guides covering core technical analysis concepts. For example, understanding how to identify support and resistance levels gives context to the price zones an investor is planning entries and exits around, rather than picking numbers arbitrarily.
These guides are written for practical use rather than academic theory — the goal is that an investor can read a short guide, then immediately apply the concept using the charting tools and calculators on the same site. This tight loop between “learn it” and “use it” is one of the more overlooked benefits of a combined platform, since separating education from application often means concepts are learned but rarely put into practice consistently.
| Investor Need | Ucharts Tool | Outcome |
|---|---|---|
| See current price trend | Real-time charts | Informed entry timing |
| Size a trade correctly | Position Size Calculator | Consistent risk per trade |
| Judge if a setup is worth taking | Risk Reward Calculator | Fewer low-quality trades |
| Understand chart structure | Educational guides | Fewer arbitrary decisions |
ComparisonDIY Research vs. Platform-Assisted Research
Some investors prefer to build their own spreadsheets and pull data from several free sources manually. This approach can work, but it depends entirely on discipline — the calculations have to be redone accurately every single time, with no built-in guardrails to catch a mistake.
A platform-assisted approach doesn’t remove the need for judgment, but it removes friction from the repeatable parts of the process. Risk percentage, position size, and reward-to-risk ratio are calculated the same way every time, which reduces the chance of a manual error slipping through during a fast-moving market.
There is also a speed advantage that matters more than it might first appear. During a live market session, prices move while an investor is still deciding. A manual spreadsheet workflow can take several minutes to update with new entry or stop-loss levels, and by the time it’s done, the original setup may no longer be valid. A built-in calculator tied directly to the chart shortens that gap considerably, which matters most for shorter time-frame trading where conditions change quickly.
VerificationWhy Independent Verification Still Matters
No research platform, including Ucharts, should be treated as a source of personalized investment advice. Tools help organize and interpret data, but investors should still verify company fundamentals through primary sources before making significant decisions. Official company filings and regulatory disclosures remain the most reliable starting point for fundamental research.
Investors in the United States can review company filings directly through regulatory channels, and general investor protection guidance is available through Investor.gov. For questions about brokers, investment products, or general market rules, FINRA’s investor resources provide independent, regulator-backed information that isn’t tied to any single platform or broker.
Practical UseWho Benefits Most from a Research Platform Like Ucharts
Beginner investors benefit from having charting, calculators, and education in one place, since it lowers the learning curve compared to piecing together separate tools from different providers. More experienced traders often benefit from the speed — running a risk-reward check or position size calculation in seconds instead of rebuilding a spreadsheet formula each time.
Active swing traders who make frequent decisions particularly benefit from having the Trade Planner and calculators built directly around the charting view, since it keeps the entire decision process in one tab instead of several.
Longer-term investors, who trade less frequently but hold larger positions, still benefit from the same core discipline. Even a handful of trades per year deserve a consistent risk framework, and having that framework readily accessible removes the excuse to skip it “just this once” — a habit that tends to erode over time if the process isn’t easy to repeat.
Wrap-UpBringing Research and Risk Management Together
An investment research platform is most valuable when it reduces the gap between analysis and action. Ucharts approaches this by combining real-time charts, focused calculators, and practical education in a single workflow, so investors spend less time switching tools and more time making disciplined, well-reasoned decisions.
Ultimately, the tools themselves don’t make decisions for you — they simply make it easier to follow a consistent, well-informed process every time. That consistency, more than any single feature, is usually what separates investors who improve over time from those who repeat the same avoidable mistakes.
To put this workflow into practice, start by reviewing how to identify support and resistance levels, then size your next position with the Position Size Calculator before entering a trade.