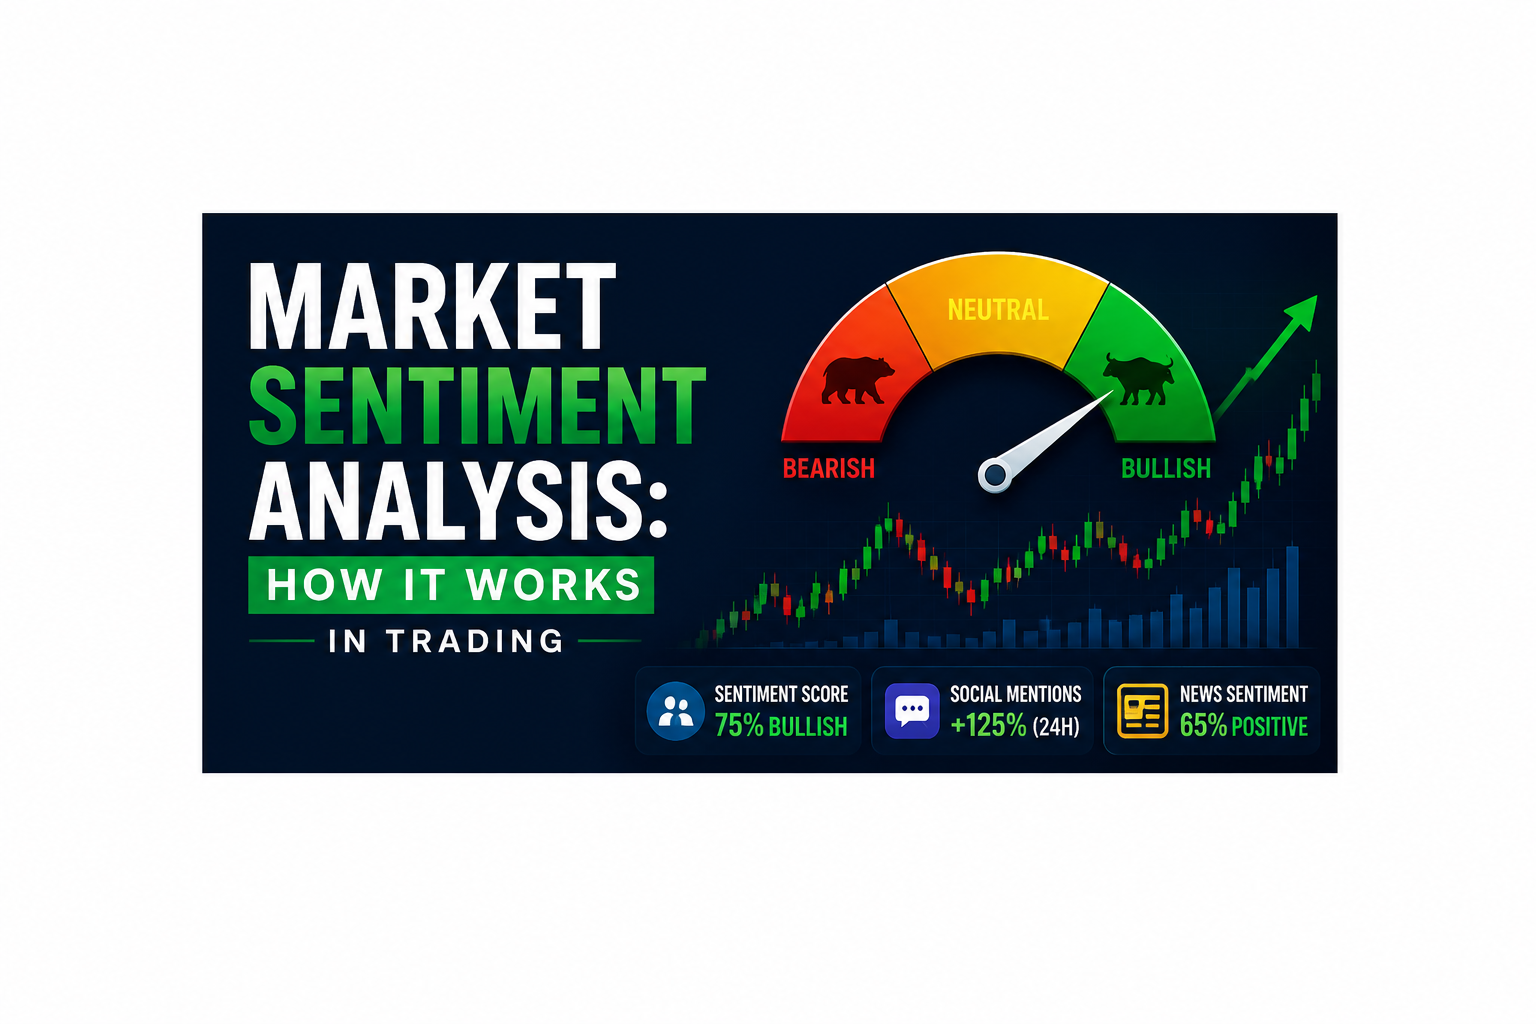
Market Sentiment Analysis: How It Works in Trading
Prices don’t move because of numbers alone — they move because of how millions of traders feel about those numbers. Market sentiment analysis is the practice of measuring that collective mood, fear, greed, optimism, or panic, and using it to anticipate where price may go next. In this guide, we break down what market sentiment really is, the indicators professionals track, and how you can fold sentiment analysis into your own trading process.
What Is Market Sentiment?
Market sentiment is the overall attitude of investors and traders toward a particular asset, sector, or the market as a whole. It reflects the balance between bullish (optimistic) and bearish (pessimistic) positioning at any given moment. Unlike fundamental analysis, which looks at earnings, revenue, or macroeconomic data, sentiment analysis looks at behavior — how people are actually positioning their money and their emotions.
Sentiment can be positive even when the underlying fundamentals are weak, and it can turn negative even when a company or asset is fundamentally sound. This gap between perception and reality is exactly what sentiment traders try to exploit.
Why Market Sentiment Matters in Trading
Markets are not purely rational. Crowds overreact to news, chase rallies out of fear of missing out, and dump assets in panic during downturns. These emotional swings create short-term mispricings that disappear once sentiment normalizes. Traders who can read sentiment accurately gain an edge in three key ways:
- Timing entries and exits — extreme sentiment often precedes reversals.
- Confirming trend strength — sustained bullish or bearish sentiment can validate an ongoing move.
- Avoiding emotional traps — recognizing crowd behavior helps traders avoid buying tops or selling bottoms out of panic.
Key Indicators of Market Sentiment
There is no single “sentiment number.” Traders combine several tools to build a fuller picture of crowd psychology. Below are the most widely used indicators.
1. Fear and Greed Index
This index aggregates several signals — momentum, volatility, safe-haven demand, and market breadth — into a single score ranging from “extreme fear” to “extreme greed.” Readings near the extremes are often treated as contrarian signals: extreme fear can mark oversold conditions, while extreme greed can warn of an overheated market.
2. Put/Call Ratio
This ratio compares the volume of put options (bets on falling prices) to call options (bets on rising prices). A high put/call ratio signals bearish positioning, while a low ratio signals bullish positioning. Extreme readings in either direction are frequently used as contrarian sentiment cues.
3. Volatility Index (VIX)
Often called the market’s “fear gauge,” the VIX measures expected volatility in the S&P 500 over the next 30 days. A rising VIX usually reflects growing fear and uncertainty, while a falling VIX suggests complacency or confidence. Traders monitoring the Cboe Volatility Index often use sharp spikes as a signal that panic selling may be reaching exhaustion.
4. Advance-Decline Line
This measures market breadth by tracking the number of advancing stocks versus declining stocks. A healthy uptrend should show broad participation; if the index rises while the advance-decline line weakens, it can signal that sentiment is narrowing and the rally may be losing strength.
5. Bullish/Bearish Sentiment Surveys
Surveys of retail and institutional investors, such as weekly polls asking whether respondents expect the market to rise or fall over the next six months, offer a direct read on crowd expectations. These surveys are frequently used as contrarian indicators when readings hit historical extremes.
6. Social Media and News Sentiment
Modern sentiment analysis also scans news headlines, financial forums, and social media chatter using natural language processing to gauge whether the tone around a stock or asset is turning positive or negative. Sudden spikes in mentions or a shift in tone can precede price moves, especially in highly retail-driven assets.
| Indicator | What It Measures | Typical Signal |
|---|---|---|
| Fear & Greed Index | Overall market mood | Extreme readings = potential reversal |
| Put/Call Ratio | Options positioning | High = bearish crowd, Low = bullish crowd |
| VIX | Expected volatility | Spikes = fear, Low levels = complacency |
| Advance-Decline Line | Market breadth | Divergence = weakening trend |
| Sentiment Surveys | Investor expectations | Extremes = contrarian setups |
How to Read Market Sentiment: Contrarian vs. Trend-Following
There are two broad philosophies for using sentiment data.
Contrarian approach: This strategy assumes that when sentiment reaches an extreme — everyone is euphoric or everyone is panicking — the market is close to a turning point. Contrarian traders look to fade extreme optimism and buy into extreme pessimism, betting that the crowd has overextended the move.
Trend-following approach: This strategy assumes that strong, sustained sentiment in one direction tends to persist, at least in the short to medium term. Rather than fighting the crowd, trend-followers ride the momentum until sentiment clearly begins to shift.
Neither approach is universally “correct.” The key is context: sentiment extremes near major support or resistance levels are more reliable contrarian signals, while sentiment building steadily during a confirmed trend is more useful as a trend-following confirmation tool.
Combining Sentiment With Technical Analysis
Sentiment data works best when it is not used in isolation. On its own, sentiment can stay extreme for longer than expected, so pairing it with price structure and momentum tools helps filter out false signals. For example, many traders wait for sentiment extremes to line up with a shift in price action before acting, rather than trading the sentiment reading alone.
It’s also worth remembering that sentiment doesn’t move in a vacuum — it’s shaped by the same underlying drivers that move prices in the first place, from earnings surprises to interest rate decisions.
Common Mistakes When Using Sentiment Analysis
- Treating sentiment as a precise timing tool. Extremes can persist for weeks before reversing.
- Ignoring the broader trend. Fading sentiment against a powerful trend is a common way to get run over.
- Relying on a single indicator. One sentiment gauge in isolation is noisy; combining several improves reliability.
- Overreacting to social media noise. Viral chatter doesn’t always translate into sustained price movement.
- Skipping risk management. Sentiment gives probability, not certainty — position sizing and stop-losses still matter.
Building a Sentiment-Based Trading Approach
A practical way to incorporate sentiment into your trading process is to treat it as a filter rather than a standalone trigger. A simple framework looks like this:
- Check broad market sentiment (Fear & Greed Index, VIX) to understand the overall backdrop.
- Look at asset-specific sentiment (put/call ratio, news tone) for the instrument you’re trading.
- Cross-reference sentiment extremes with price action and key support/resistance levels.
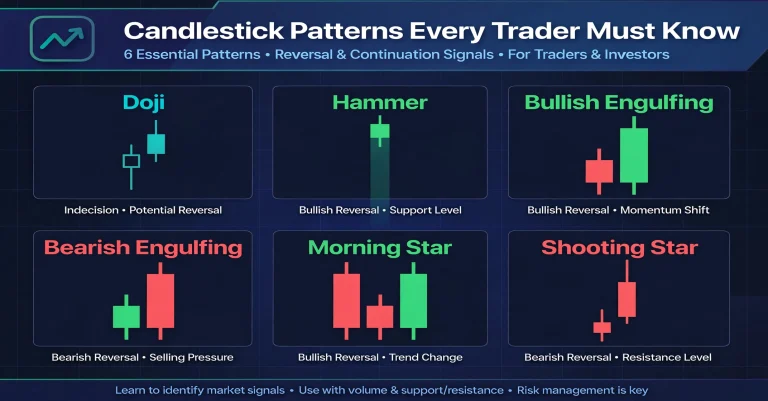
- Wait for confirmation — a reversal candle, a breakout, or a shift in momentum — before entering.
- Size the position according to your risk tolerance, since sentiment reversals can be sharp and fast.
For traders who also want to understand how sentiment interacts with broader market cycles, learning to read price trends at a higher level is equally important — momentum, breadth, and sentiment tend to move together during major market phases.
Tools for Tracking Market Sentiment
Beyond dedicated sentiment indices, many traders rely on general research platforms to cross-check sentiment against fundamentals and definitions. Reference sites such as Investopedia’s overview of market sentiment are useful for revisiting core concepts, while volatility data from Cboe remains one of the most widely cited sources for gauging fear in the options market. Combining these external references with your own chart-based analysis gives a more complete, well-rounded view before placing a trade.
Market Sentiment in Stocks vs. Crypto vs. Forex
Sentiment doesn’t behave the same way across every market, and understanding these differences helps traders avoid applying a one-size-fits-all approach.
Stock Market Sentiment
In equities, sentiment is heavily influenced by earnings season, economic data releases, and central bank policy. Institutional flows tend to dominate, so sentiment shifts in stocks often build gradually, reflected in things like fund positioning, analyst upgrades or downgrades, and sector rotation. Because large institutions move slowly, extreme sentiment readings in stocks can persist for weeks or even months before reversing.
Cryptocurrency Sentiment
Crypto markets are dominated by retail participation and are far more reactive to social media, influencer commentary, and viral news cycles. Sentiment swings can happen within hours rather than weeks, and indicators like social mention volume or exchange inflow/outflow data are often just as important as traditional indices. This makes crypto sentiment both a powerful and a dangerous tool — moves are faster, but so are the reversals.
Forex Sentiment
Currency markets are shaped by macroeconomic sentiment: interest rate expectations, geopolitical risk, and central bank tone. Because forex is largely driven by institutional and algorithmic flows, sentiment here is often measured through positioning reports and risk-on/risk-off behavior across correlated assets like bonds and commodities, rather than retail-focused indices.
A Practical Example of Sentiment in Action
Consider a scenario where a widely followed stock has rallied for several weeks on strong earnings. As the rally extends, sentiment surveys show an overwhelming majority of investors turning bullish, the put/call ratio drops to multi-month lows, and social media chatter around the stock spikes sharply. On the surface, everything looks positive. But from a sentiment standpoint, this is often a warning sign: when nearly everyone who wants to buy has already bought, there are fewer new buyers left to push the price higher, and the market becomes vulnerable to even a small piece of disappointing news.
A sentiment-aware trader wouldn’t necessarily short the stock immediately, but they would tighten risk management, watch for the first signs of reversal in price action, and avoid chasing the rally purely because “everyone else” is bullish. This is the essence of using sentiment as a risk filter rather than a standalone signal.
Frequently Asked Questions
Is market sentiment analysis reliable on its own?
Not entirely. Sentiment is a probabilistic tool, not a precise timing mechanism. It works best as one layer in a broader trading process that also includes price action, risk management, and awareness of the underlying fundamentals driving a market.
How often should sentiment be checked?
For swing and position traders, checking broad sentiment indicators a few times a week is usually sufficient. Day traders and short-term traders in fast-moving markets like crypto may want to monitor sentiment shifts more frequently, since crowd mood can change within hours.
Can beginners use sentiment analysis effectively?
Yes, but beginners should start with the most established indicators — such as the Fear & Greed Index and the VIX — before layering in more advanced tools like options positioning or social sentiment scanners. Pairing sentiment with a solid understanding of price action, as covered in our price action guide above, makes the learning curve much smoother.
Conclusion
Market sentiment analysis won’t tell you exactly when a market will turn, but it gives you a powerful lens into the psychology driving price action. By tracking indicators like the Fear & Greed Index, the VIX, and the put/call ratio, and combining them with solid price action and an understanding of the fundamental factors that move markets, traders can make more informed, less emotionally reactive decisions. Used correctly, sentiment analysis becomes less about predicting the future and more about understanding the crowd well enough to avoid being swept up in it.
Want to put sentiment and price action to work together?
Explore UCharts tools and guides →